Unveiling Heiken Ashi: A Deep Dive for Traders
This is a trial version. Get full version here.
⬇⬇⬇ [FREE DOWNLOAD AT BOTTOM OF PAGE] ⬇⬇⬇
In the dynamic world of financial trading, discerning market trends and price action can often feel like navigating a stormy sea. Traditional candlestick charts, while providing a wealth of information, can sometimes be too noisy, reflecting every minor fluctuation and creating a challenging environment for clear trend identification. Enter Heiken Ashi, a powerful charting technique designed to smooth out price data and offer a clearer, more insightful view of market direction. It’s important to note, as a rule of thumb, that while Heiken Ashi excels at revealing trends, it does not show the precise high and low of the price movement within each period, as its calculations average out these extremes.
The Genesis of Clarity: A Brief History of Heiken Ashi
The term “Heiken Ashi” is Japanese for “average bar,” and true to its name, this method is fundamentally about averaging price data. While the exact origins are somewhat shrouded in the mists of time, Heiken Ashi is widely attributed to Munehisa Homma, the legendary Japanese rice merchant who also developed the widely used candlestick charting method in the 18th century. Homma, renowned for his astute market observations and psychological insights, understood the importance of filtering out market noise to identify underlying trends more effectively.
Unlike traditional candlesticks that plot the open, high, low, and close of a period independently, Heiken Ashi candles are calculated using a modified formula that incorporates elements from the previous candle, creating a smoother progression. This averaging process reduces the visual “noise” of choppy markets, making trends easier to spot and reversals more apparent. Over the centuries, Homma’s innovations have continued to influence technical analysis, with Heiken Ashi serving as a testament to his enduring legacy in simplifying complex market data.
The MetaTrader 5 Conundrum: Indicators vs. True Candles
For many traders utilizing the popular MetaTrader 5 (MT5) platform, their first encounter with Heiken Ashi often involves an “indicator” rather than a dedicated chart type. MT5, by default, provides a Heiken Ashi indicator that, when applied, overlays a set of calculated Heiken Ashi “candles” directly onto a standard candlestick chart. While this overlay can offer a quick visual interpretation of smoothed price action, it comes with a significant limitation: these are merely visual representations on top of the actual price data. 
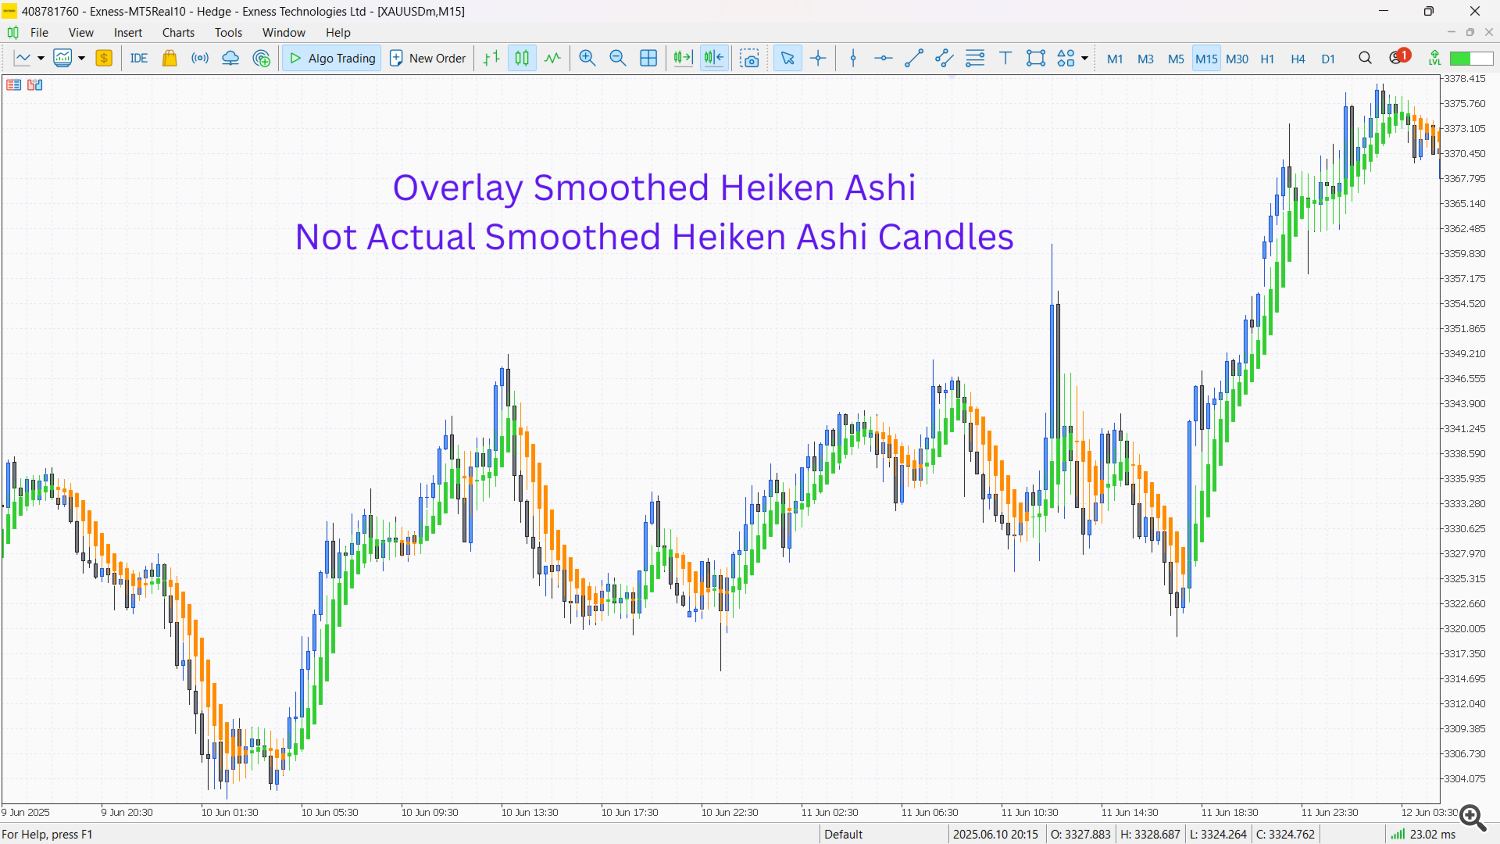
The crucial drawback of using the Heiken Ashi overlay indicator in MT5 is that you cannot directly apply other technical indicators to these smoothed candles. Indicators like Moving Averages, RSI, or Stochastic Oscillators will continue to calculate based on the underlying standard candlestick data, not the smoothed Heiken Ashi values. This severely limits the analytical power for traders who wish to combine the trend-spotting capabilities of Heiken Ashi with their preferred analytical tools. The overlay serves as a visual aid, but not as a foundation for integrated technical analysis.
The Solution: Expert Advisors for True Heiken Ashi Charts
Recognizing this limitation, the MetaTrader community developed ingenious solutions in the form of Expert Advisors (EAs). These Heiken Ashi EAs are designed to calculate and plot actual Heiken Ashi candles on a custom chart. How does this work? The EA typically runs on a standard chart (e.g., a 1-minute chart of EURUSD) and then uses the incoming price data to compute the Heiken Ashi values. It then creates a new, separate custom chart where these computed Heiken Ashi candles are plotted.
This transformative approach allows traders to have a true Heiken Ashi chart, just like a regular candlestick chart. Furthermore, many of these EAs offer the capability to generate “smoothed” Heiken Ashi candles. Smoothed Heiken Ashi takes the averaging process a step further, often by applying a moving average to the Heiken Ashi calculations themselves. This results in an even cleaner and more defined trend representation, further reducing noise and providing a clearer signal of market direction and momentum.
The Unquestionable Advantage: Actual Candles vs. Overlay
The difference between using an EA-generated true Heiken Ashi chart and the standard MT5 overlay indicator is monumental. The primary and most significant advantage of having actual Heiken Ashi candles is the ability to apply any and all technical indicators directly onto them.
Imagine applying a Moving Average Convergence Divergence (MACD) indicator to a standard chart that is showing choppy price action. The MACD will reflect that choppiness. Now, imagine applying that same MACD to a Heiken Ashi chart where the trends are smoothed and clearly defined. The MACD signals will become clearer, potentially offering earlier and more reliable indications of trend strength, continuation, or reversal, as they are now reacting to the smoothed Heiken Ashi price action rather than the raw, noisy data.
This capability unlocks a new dimension of analysis, allowing traders to build sophisticated strategies by combining the inherent trend-filtering benefits of Heiken Ashi with the analytical power of their favorite indicators, leading to potentially more robust and clearer trading signals.
Naked Strategies: Reading the Message of the Candles
One of the most compelling aspects of Heiken Ashi, especially the smoothed variant, is its ability to convey powerful messages through its candle formations, even without additional indicators. These are often referred to as “naked strategies”:
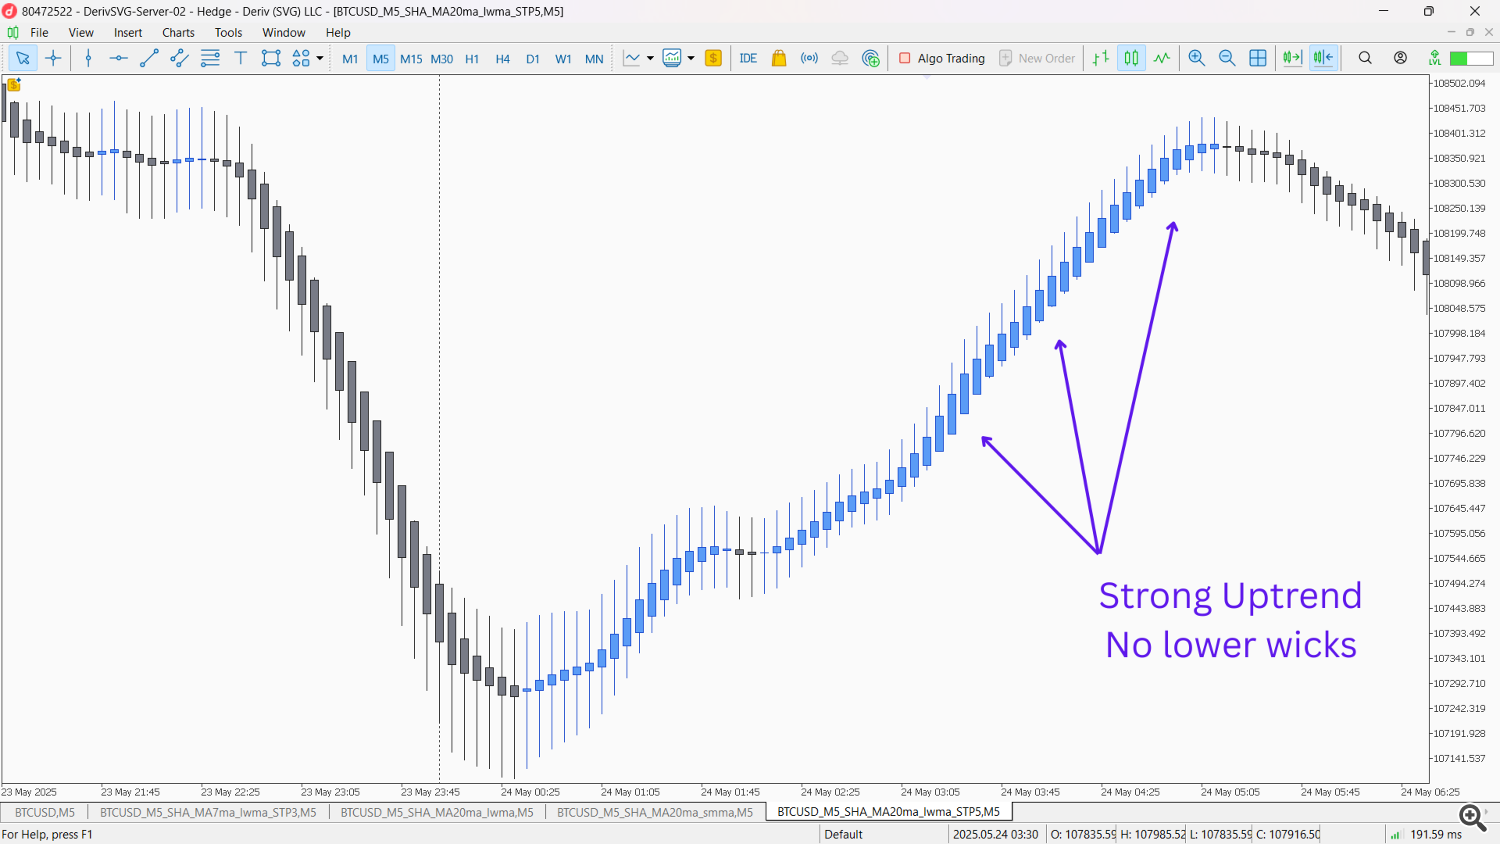
- Strong Trends (No Wicks): When Heiken Ashi candles appear with little to no wicks, particularly on the opposing side of the trend, it signifies strong buying or selling pressure.
- Strong Uptrend: Long, green (or bullish-colored) Heiken Ashi candles with small or no lower wicks indicate strong buying momentum. This suggests that buyers are in firm control, and the trend is likely to continue.
- Strong Downtrend: Long, red (or bearish-colored) Heiken Ashi candles with small or no upper wicks signal intense selling pressure. This indicates sellers are dominant, and the downtrend is robust.
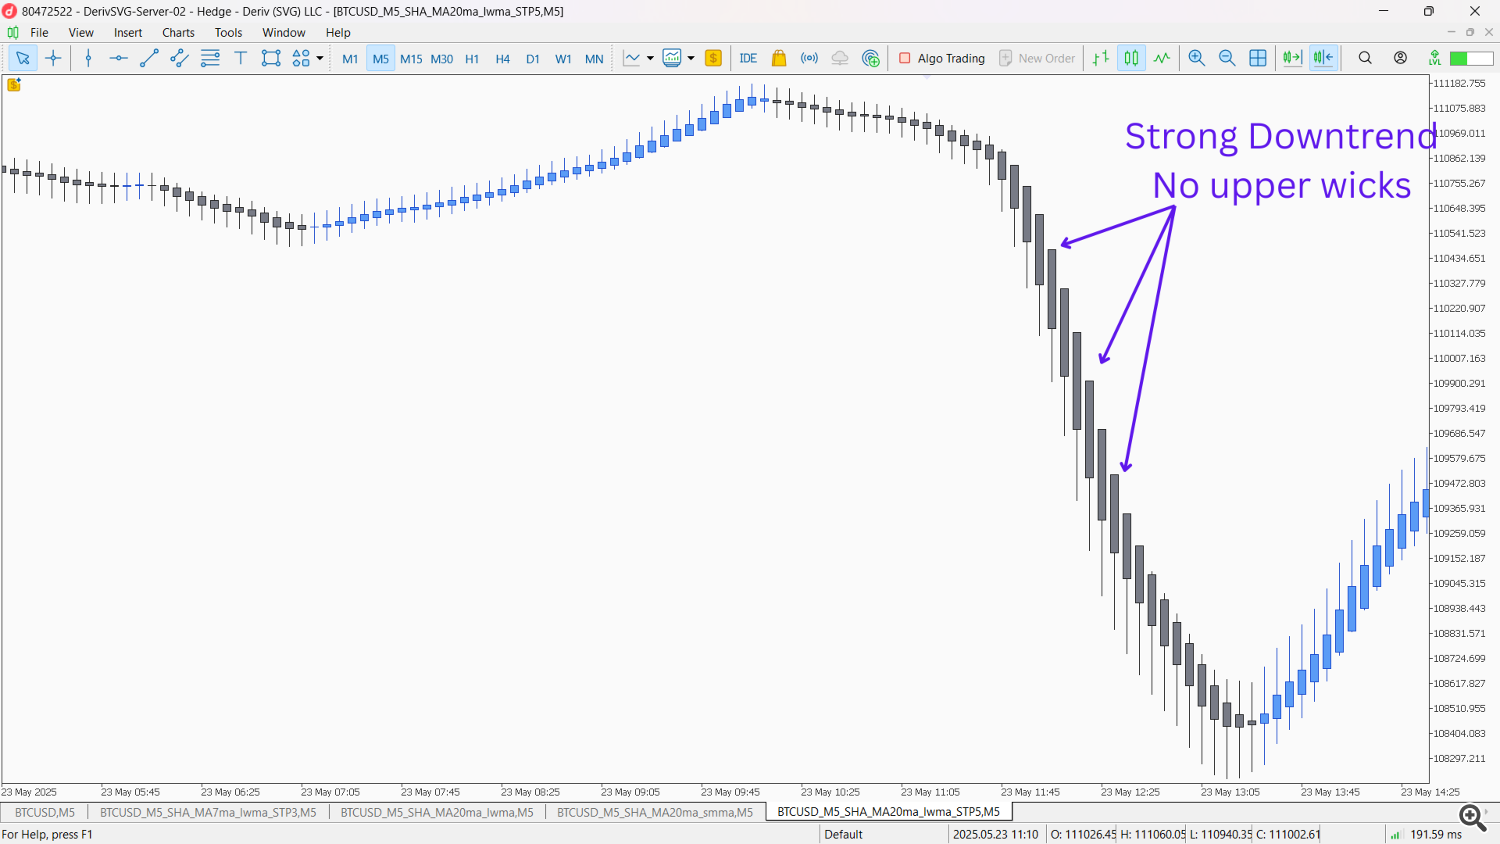
- Smoothed Heiken Ashi excels in highlighting these strong trend candles due to its further reduction of noise, making these “wickless” signals even more apparent and reliable.
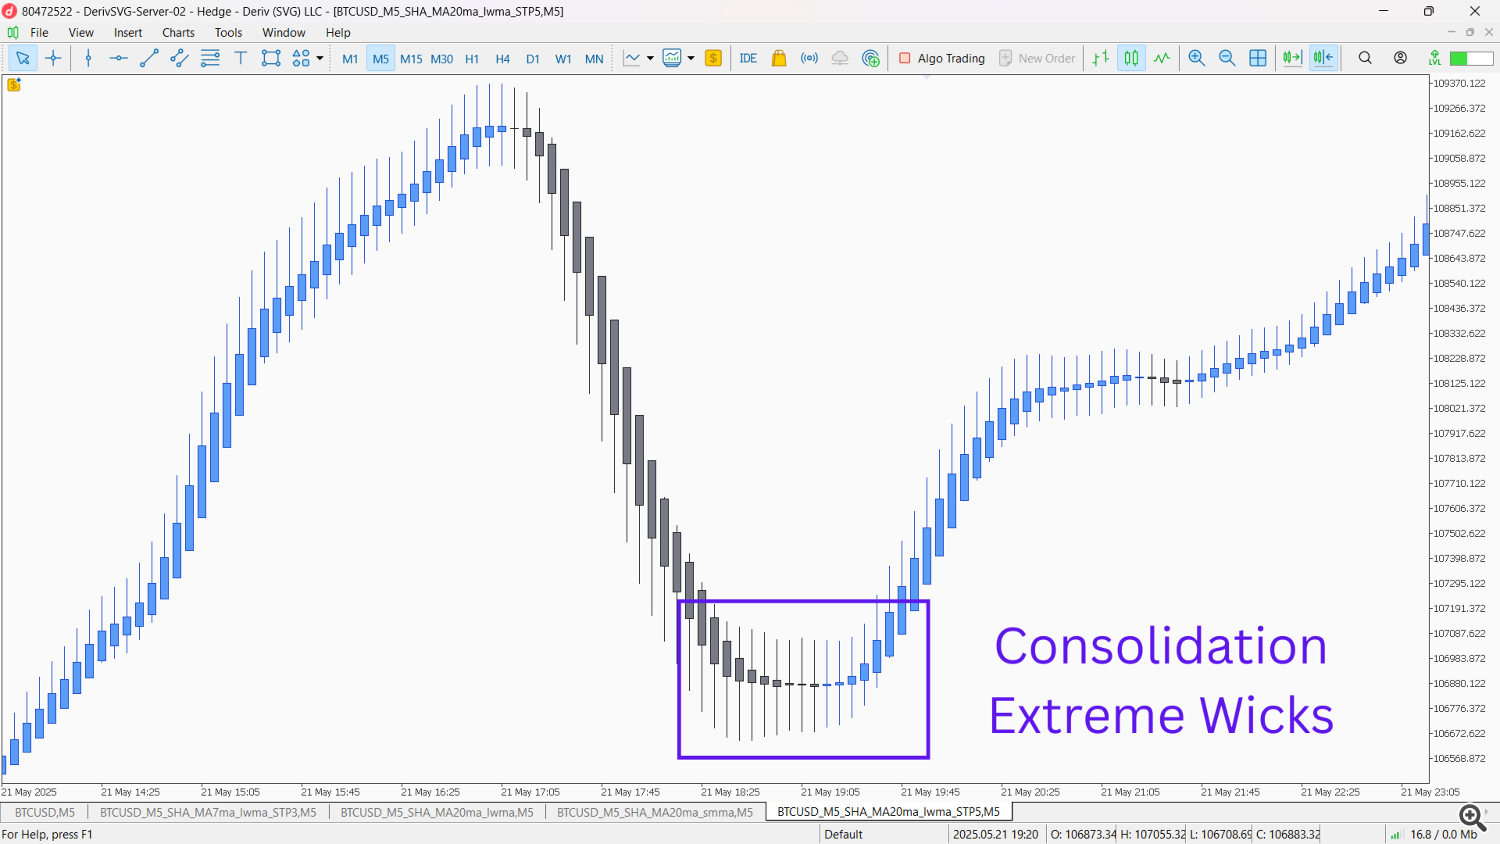
- Trend Weakening/Consolidation: Smaller Heiken Ashi candles with longer wicks on both sides often suggest indecision, consolidation, or a weakening of the current trend. This might precede a reversal or a period of sideways movement.
- Reversal Signals: A change in the color of the Heiken Ashi candle, especially after a prolonged trend, accompanied by a shift in wick patterns (e.g., a strong downtrend showing a red candle with a long upper wick, followed by a bullish candle), can be a strong indication of a potential reversal.
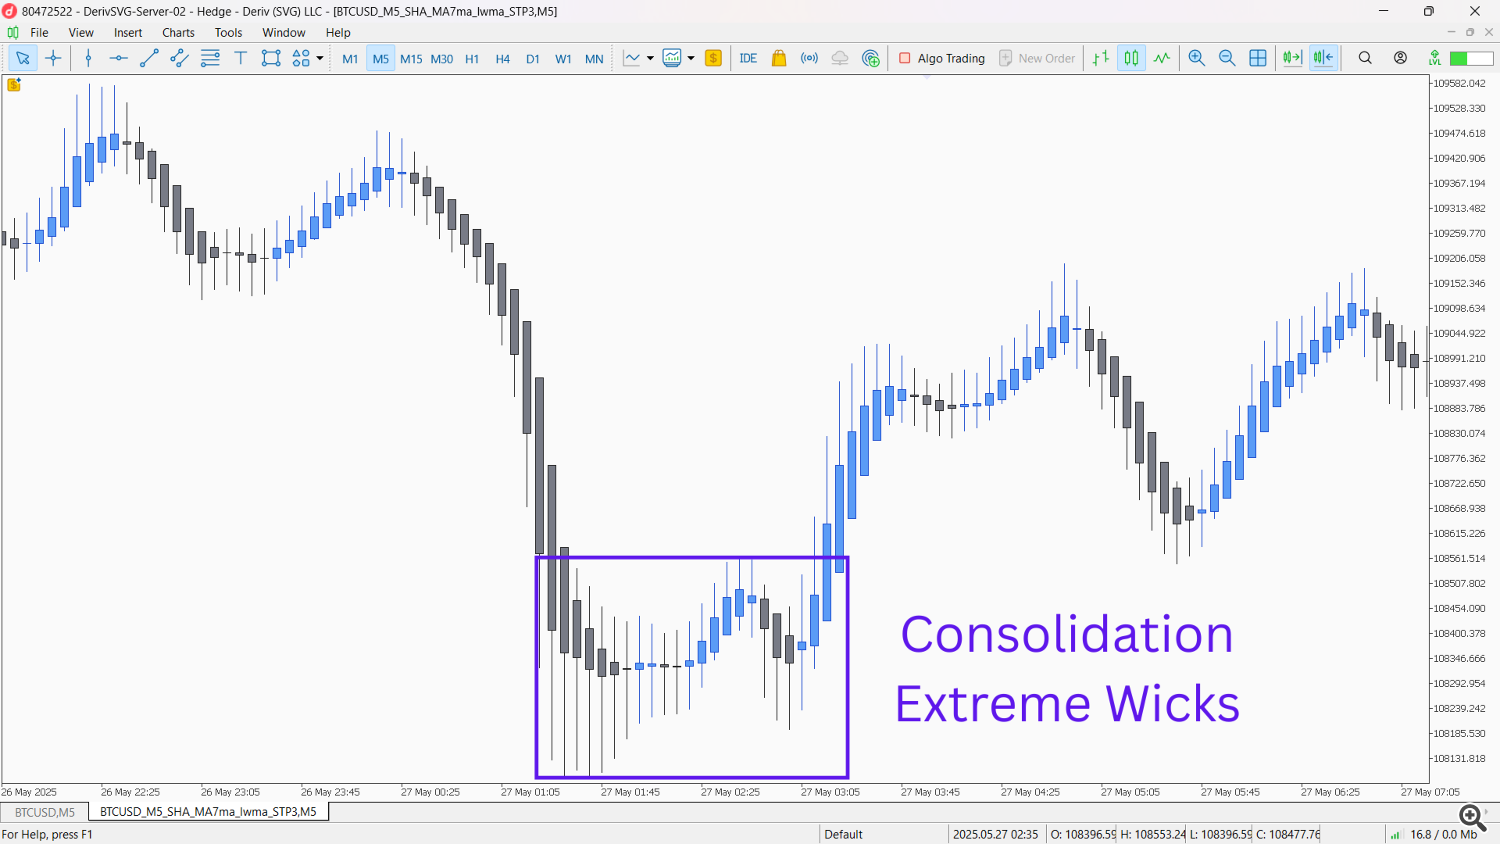
These visual cues, particularly the presence or absence of wicks, provide a simplified yet potent way to gauge market momentum and health, allowing traders to make informed decisions without cluttering their charts with multiple indicators.
Orchestrated Strategies: Combining Heiken Ashi with Indicators
While powerful on its own, Heiken Ashi truly shines when integrated with other technical indicators. Here are examples of how you can combine them for continuation and reversal strategies:
Continuation Strategies: Riding the Trend
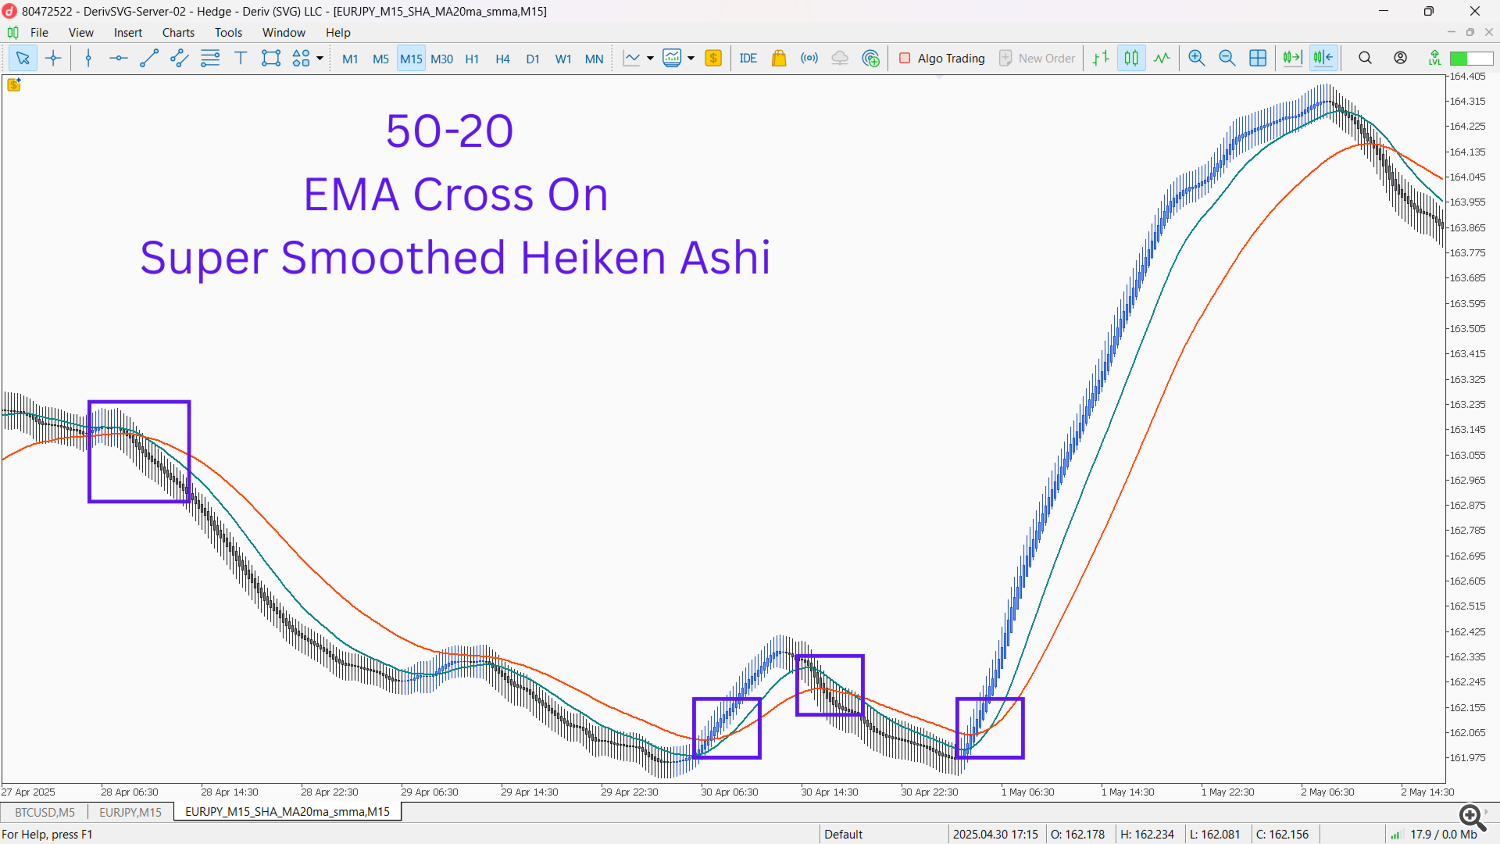
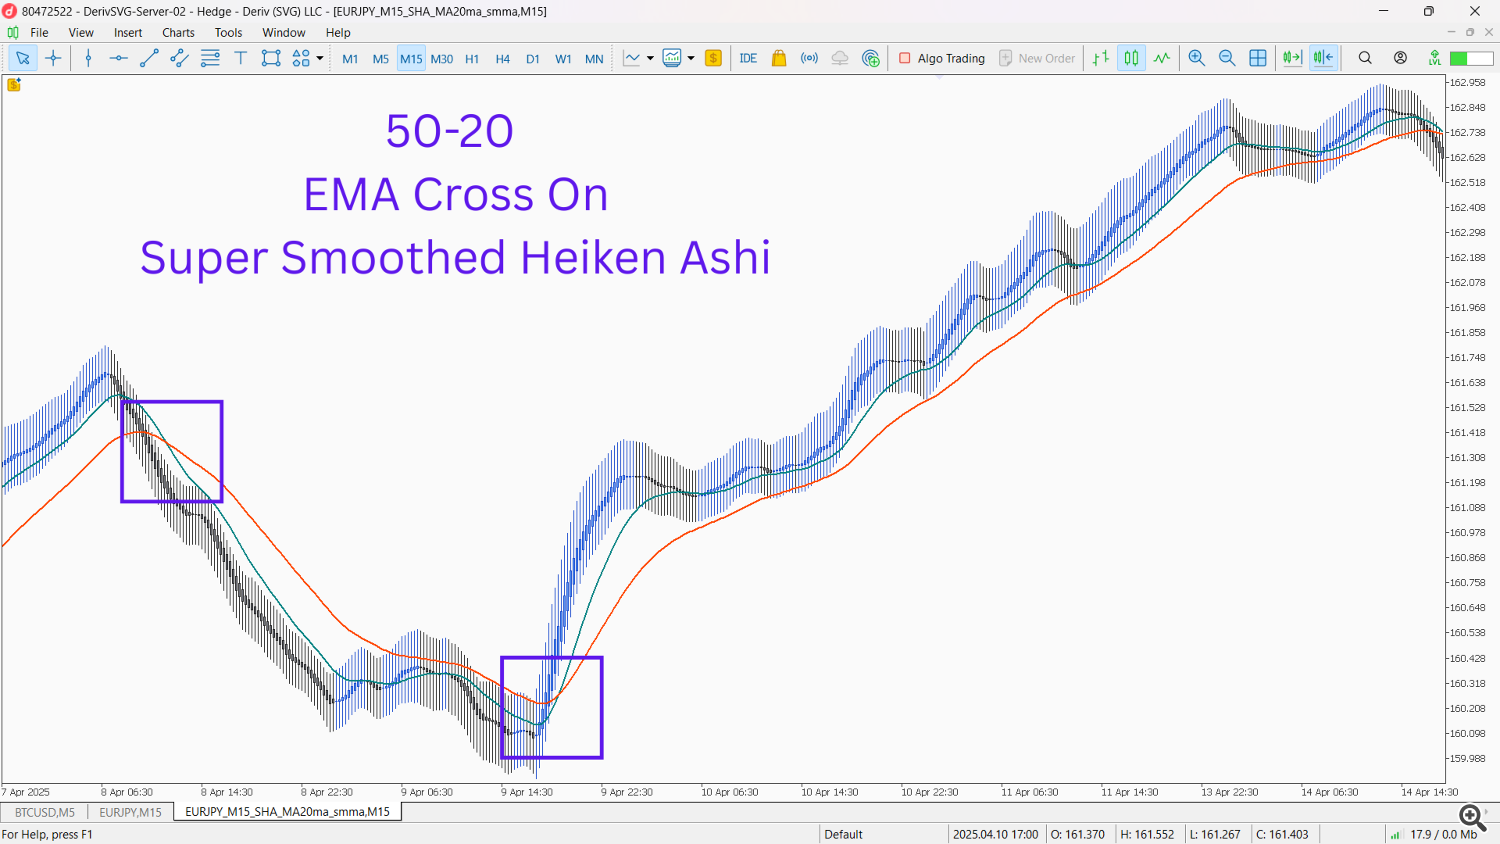
- Heiken Ashi + Moving Averages Cross:
- Setup: Plot a 20-period Exponential Moving Average (EMA) and a 50-period EMA on your Heiken Ashi chart.
- Signal: When the Heiken Ashi candles are consistently green and above both EMAs, and the 20 EMA crosses above the 50 EMA, it confirms a strong bullish trend continuation. Conversely, red candles below both EMAs, with the 20 EMA crossing below the 50 EMA, signal a bearish continuation.
- Rationale: The EMAs provide dynamic support/resistance, and their alignment with the smooth Heiken Ashi trend indicates robust momentum.
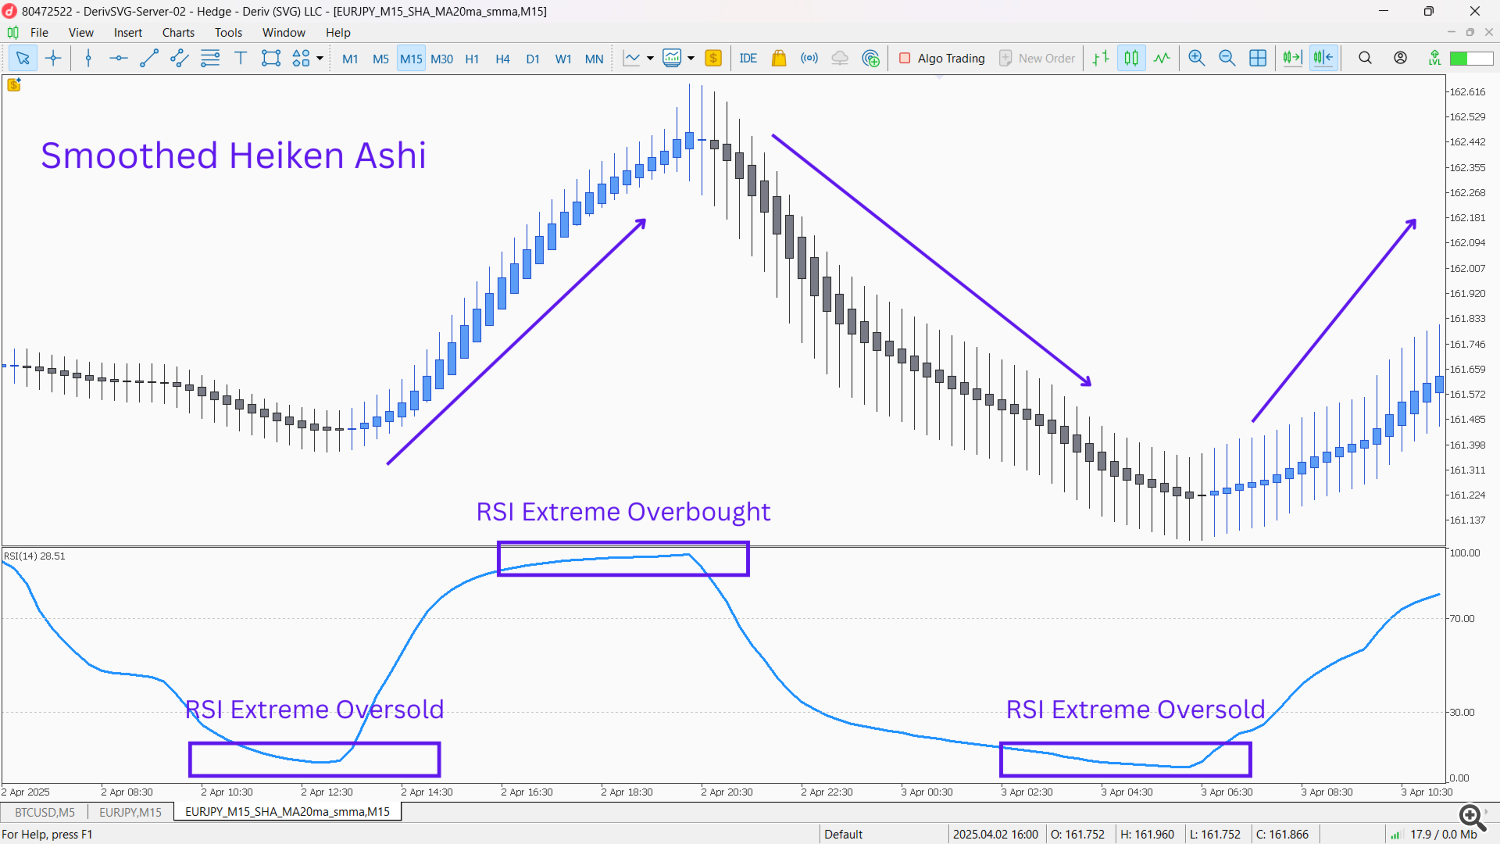
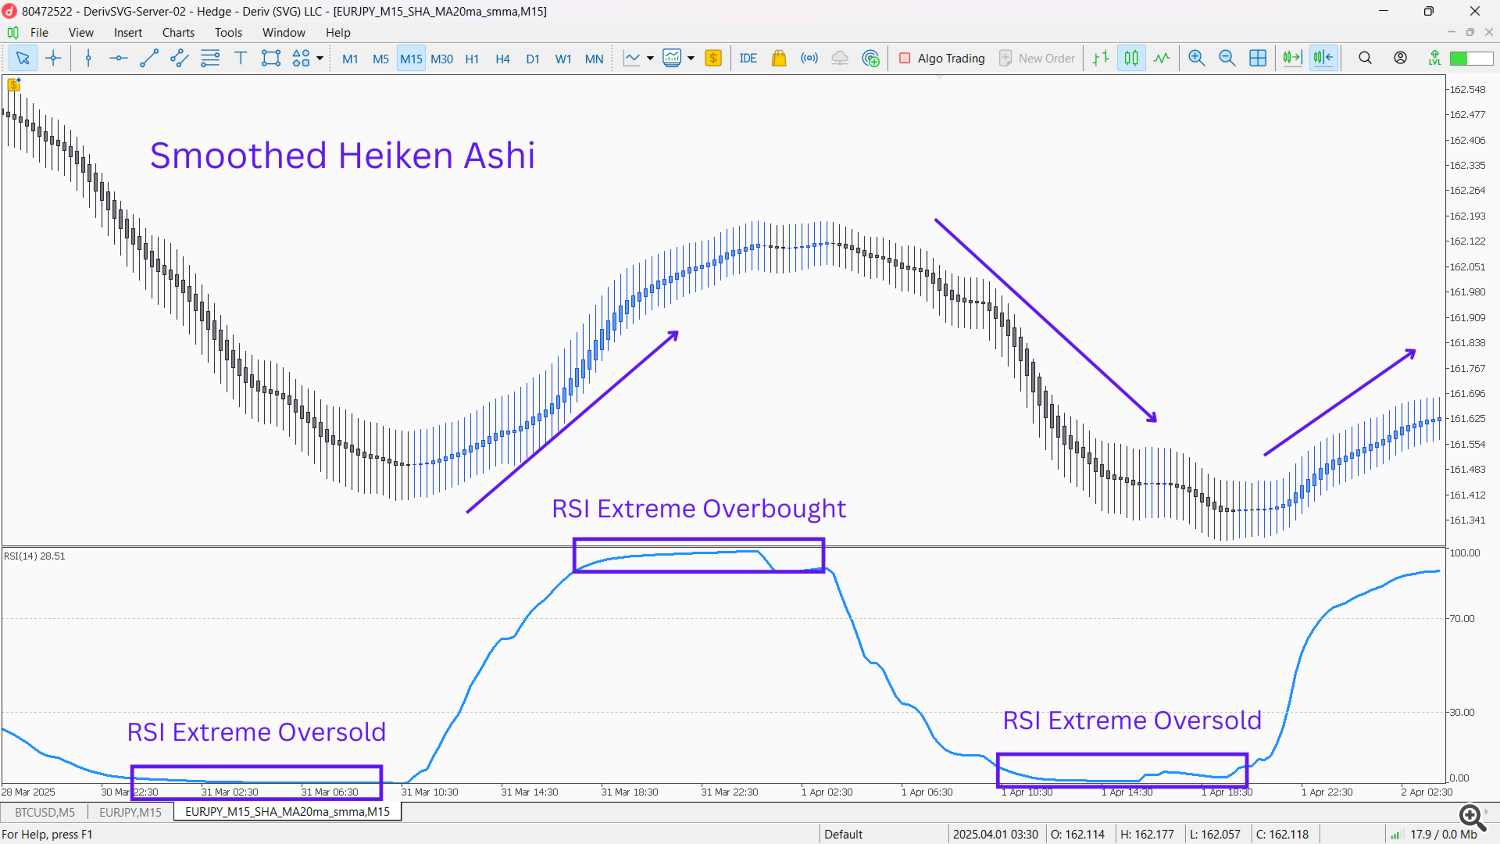
- Heiken Ashi + Relative Strength Index (RSI) for Overbought/Oversold Confirmation:
- Setup: Add the RSI indicator (e.g., 14 periods) to your Heiken Ashi chart.
- Signal: During an established Heiken Ashi uptrend (green candles, minimal lower wicks), if the RSI pulls back from overbought levels (e.g., below 70) but remains above 50, and then the Heiken Ashi candles continue to be green with strong bodies, it suggests the trend is strong and resuming after a minor pullback. The opposite applies for downtrends (RSI pulls back from oversold, stays below 50, and red Heiken Ashi continues).
- Rationale: This combination identifies healthy pullbacks within a strong trend, preventing premature exits.
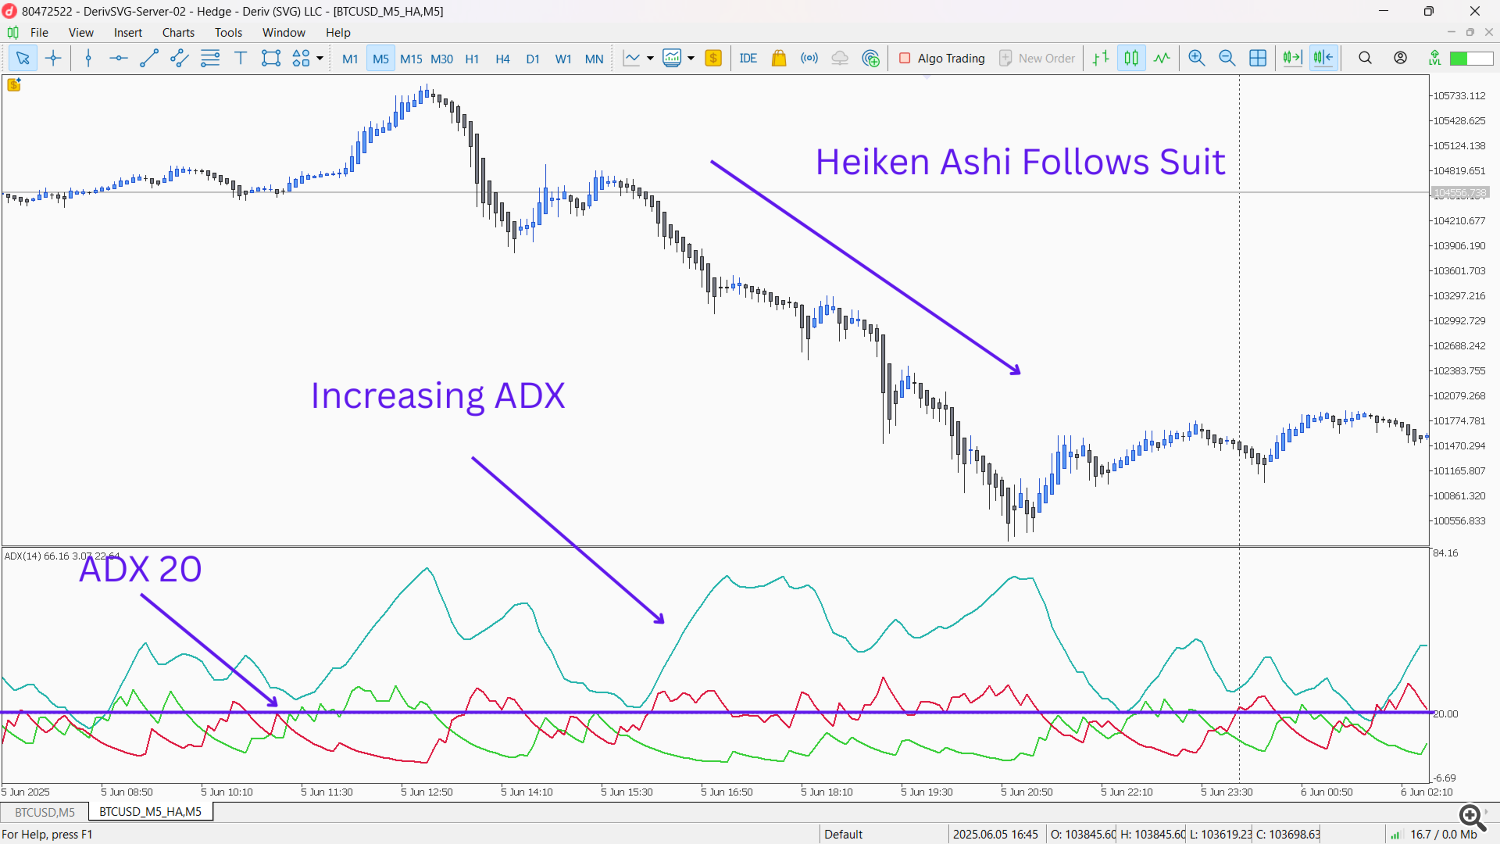
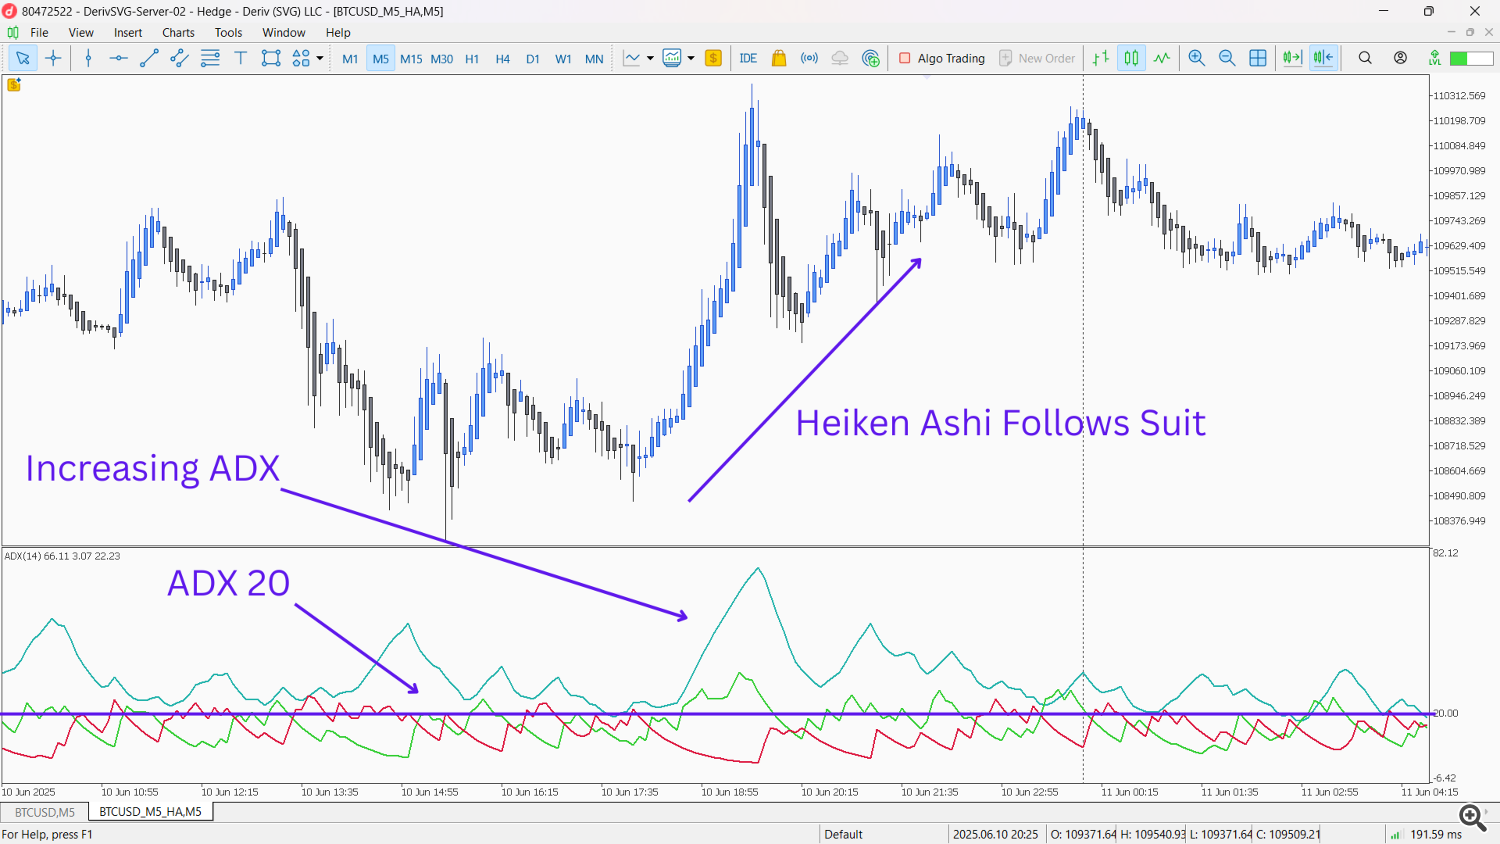
- Heiken Ashi + Average Directional Index (ADX) for Trend Strength:
- Setup: Apply the ADX indicator (e.g., 14 periods) to your Heiken Ashi chart.
- Signal: When Heiken Ashi candles are clearly showing a strong trend (consistent color, minimal opposing wicks) and the ADX line is rising and above 20, it indicates that the trend identified by Heiken Ashi has significant strength and is likely to continue.
- Rationale: ADX quantifies trend strength, adding conviction to the visual trend identified by Heiken Ashi.
Reversal Strategies: Catching the Turn
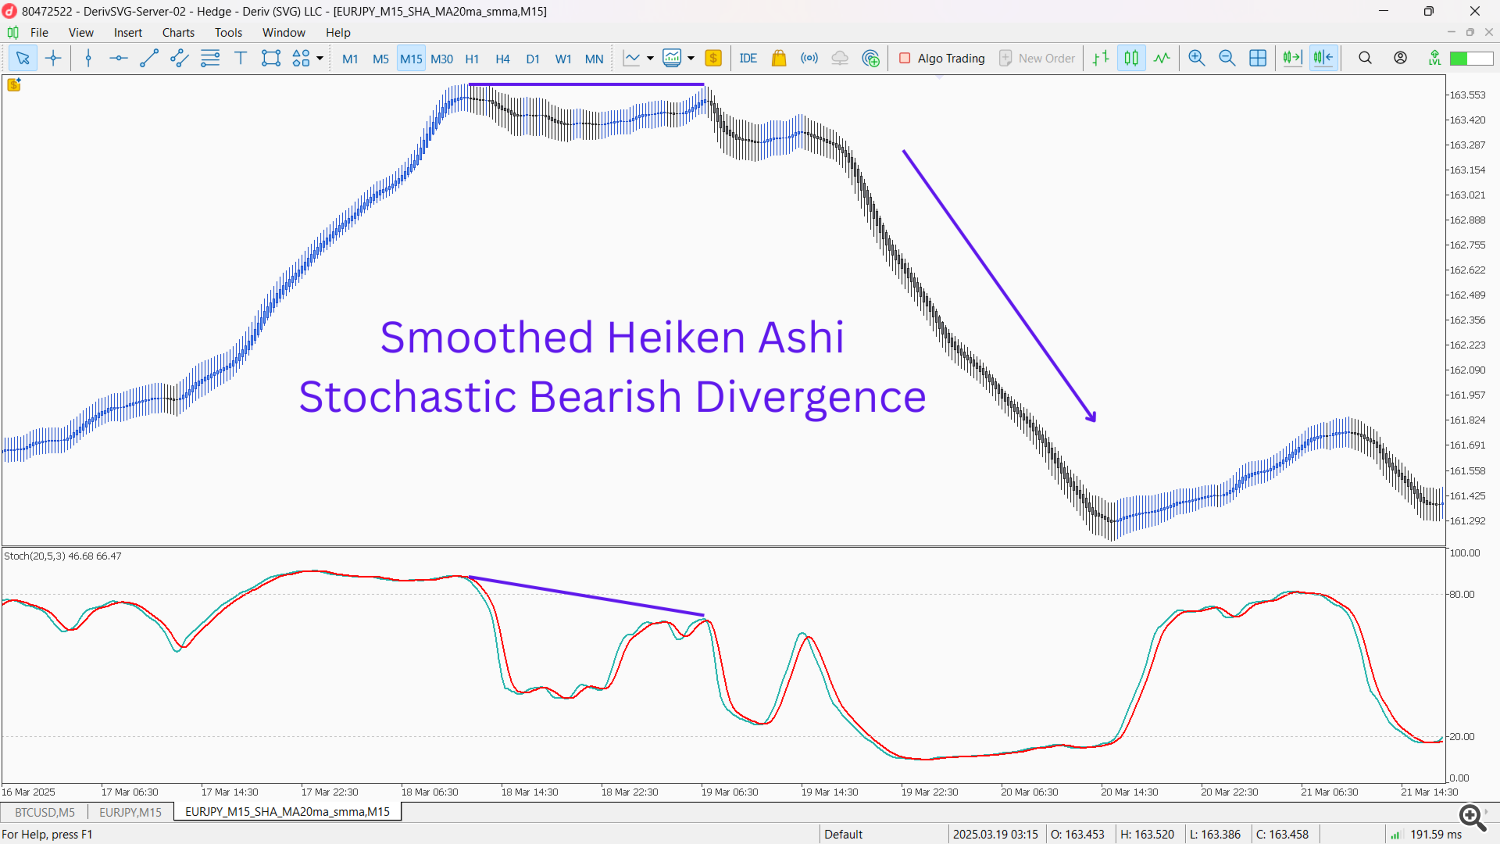
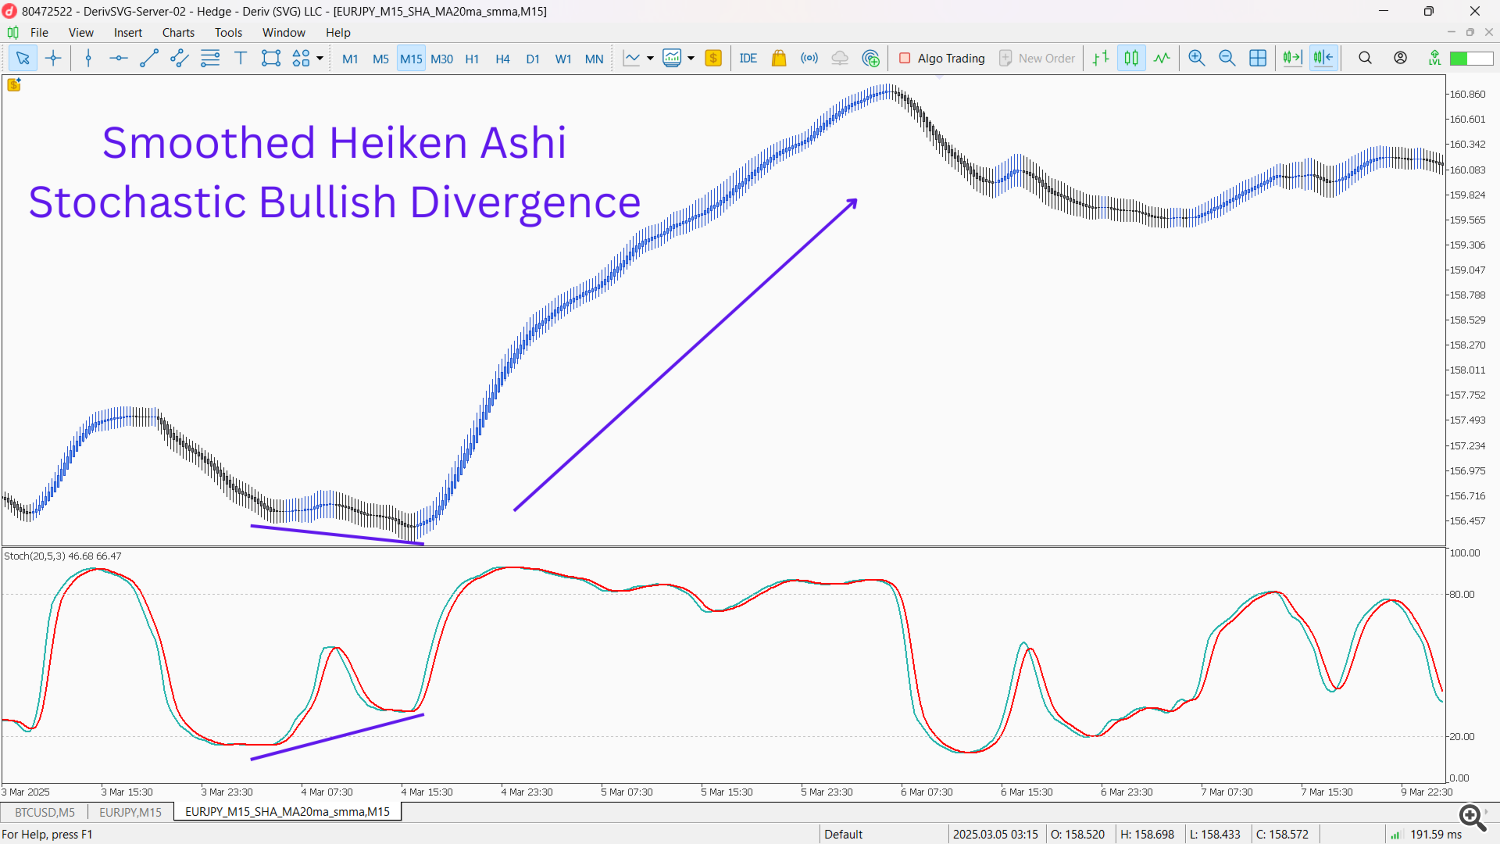
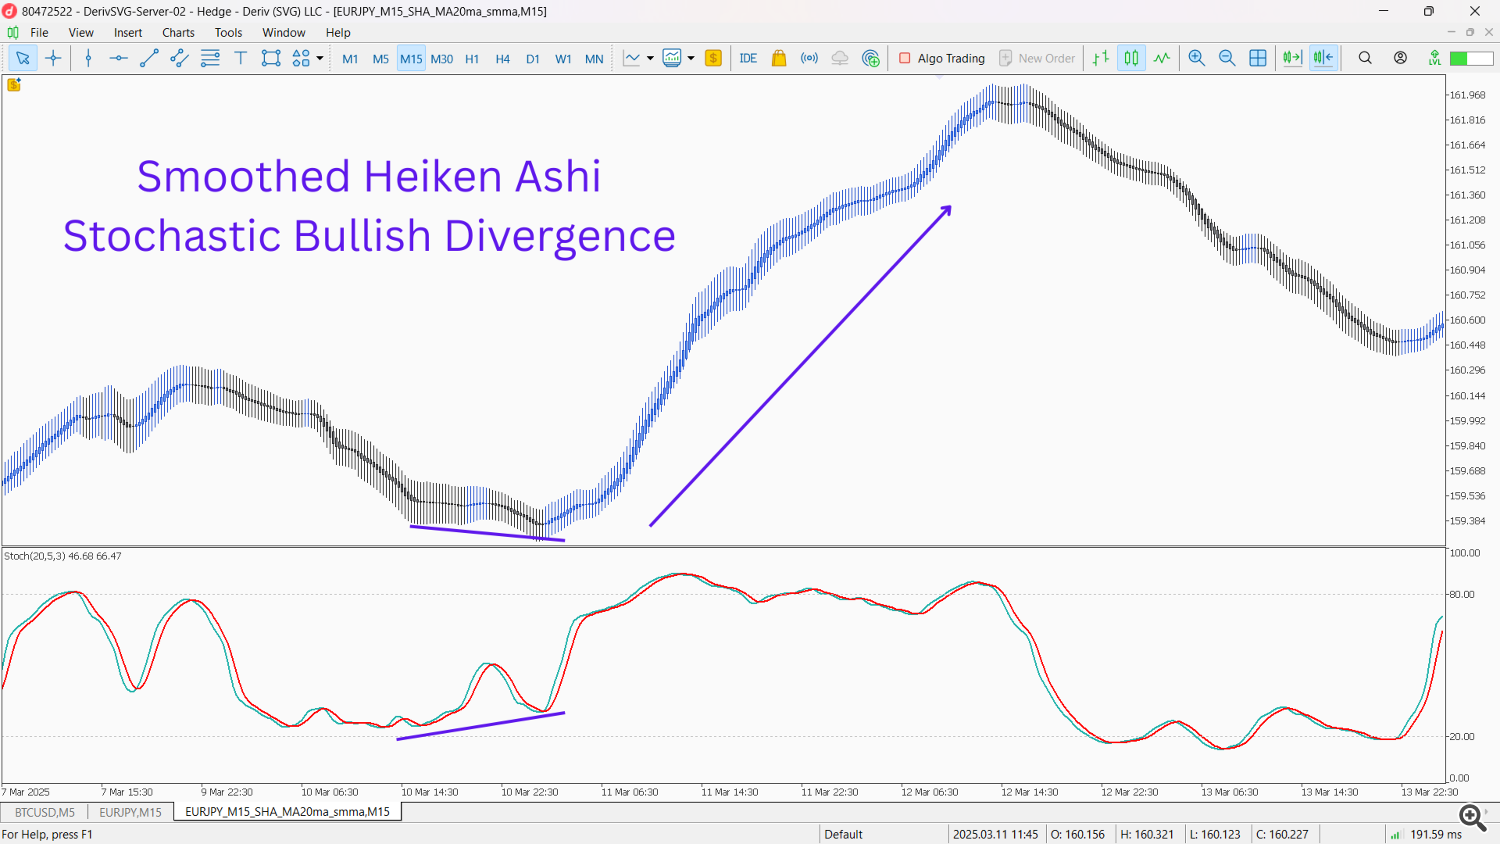
- Heiken Ashi + Stochastic Oscillator for Divergence:
- Setup: Add the Stochastic Oscillator (e.g., %K=14, %D=3, Slowing=3) to your Heiken Ashi chart.
- Signal: Look for divergence. If price (represented by Heiken Ashi candles making higher highs) fails to be confirmed by the Stochastic Oscillator (making lower highs), it’s a bearish divergence, signaling a potential reversal downwards. Conversely, if price makes lower lows, but Stochastic makes higher lows, it’s a bullish divergence, indicating an impending upward reversal. The Heiken Ashi candle color change then confirms the reversal.
- Rationale: Divergence is a powerful early warning of a potential trend shift, and Heiken Ashi’s smoothing makes the price highs/lows clearer for divergence identification.
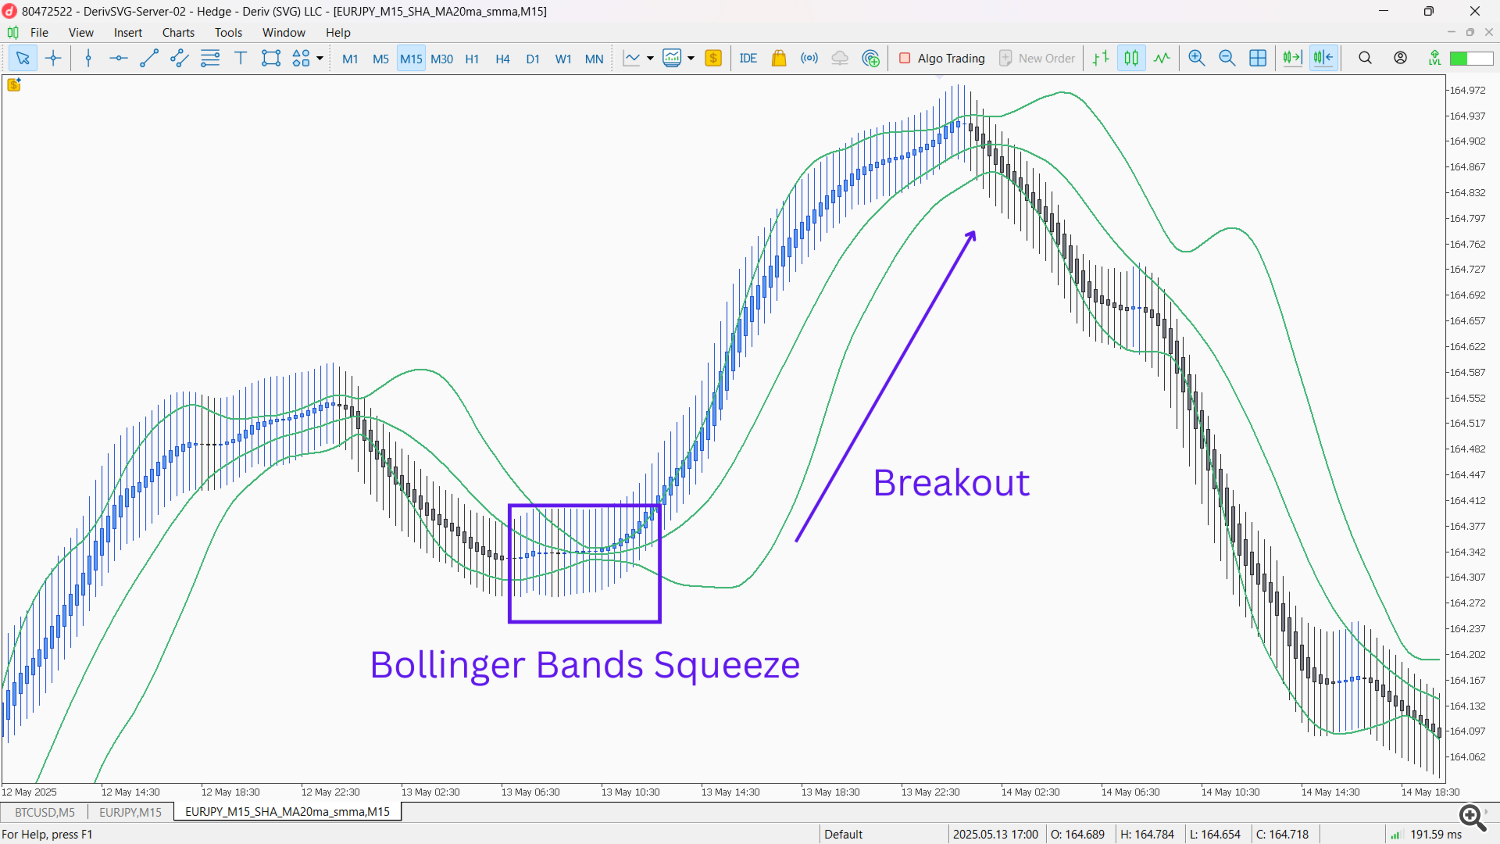
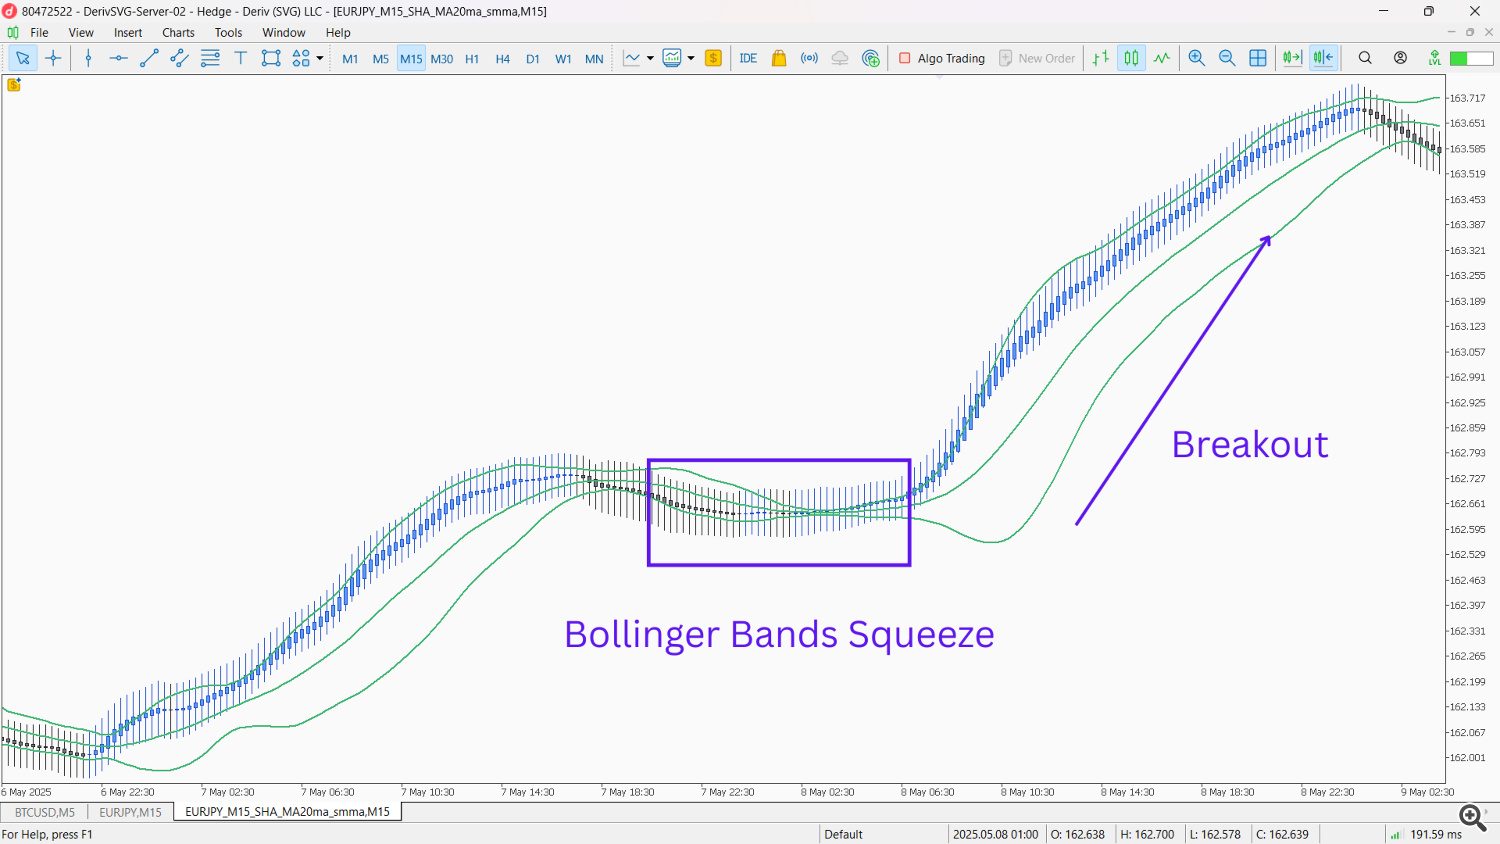
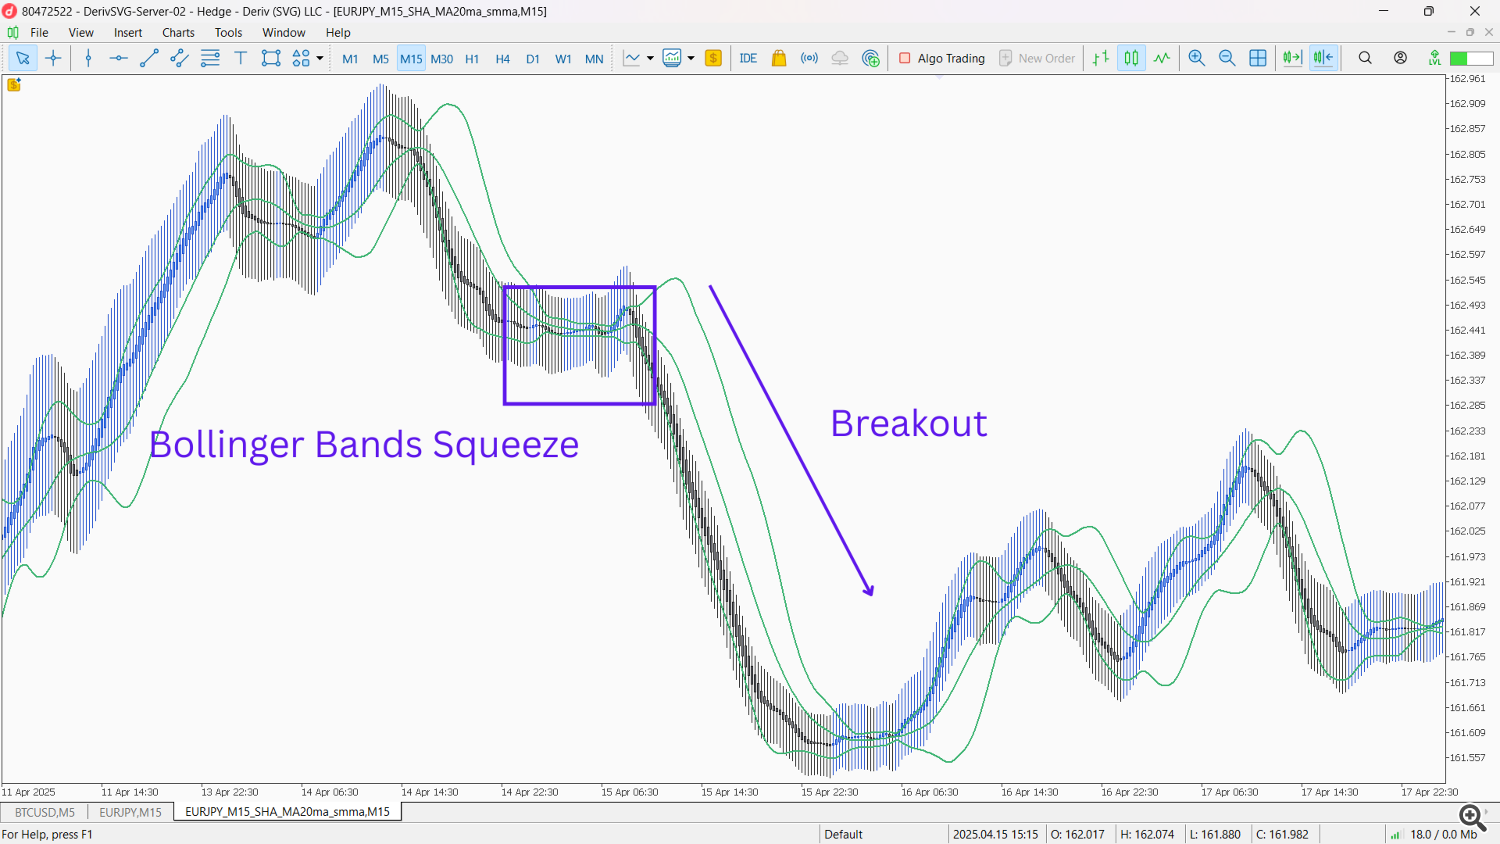
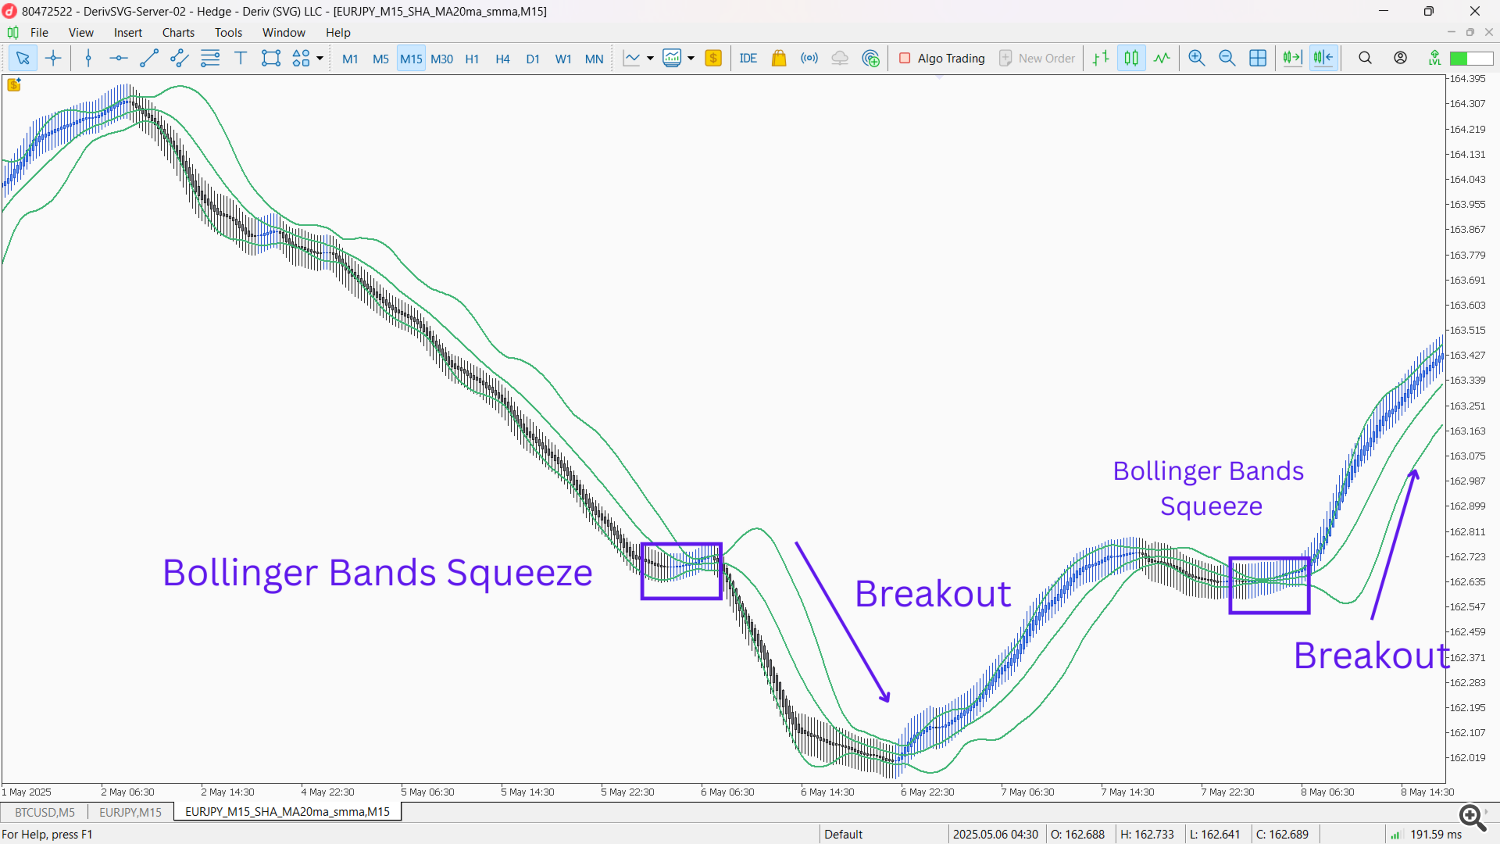
- Heiken Ashi + Bollinger Bands Squeeze and Expansion:
- Setup: Apply Bollinger Bands to your Heiken Ashi chart.
- Signal: A “squeeze” in the Bollinger Bands (bands narrowing significantly) while Heiken Ashi candles are small and showing indecision suggests low volatility, often preceding a major price move. An “expansion” of the bands, coupled with a breakout and change in Heiken Ashi candle color (e.g., green candle breaking above the upper band after a squeeze), signals the start of a new trend or reversal.
- Rationale: Bollinger Bands show volatility, and their interaction with Heiken Ashi can pinpoint accumulation phases before strong breakouts/reversals.
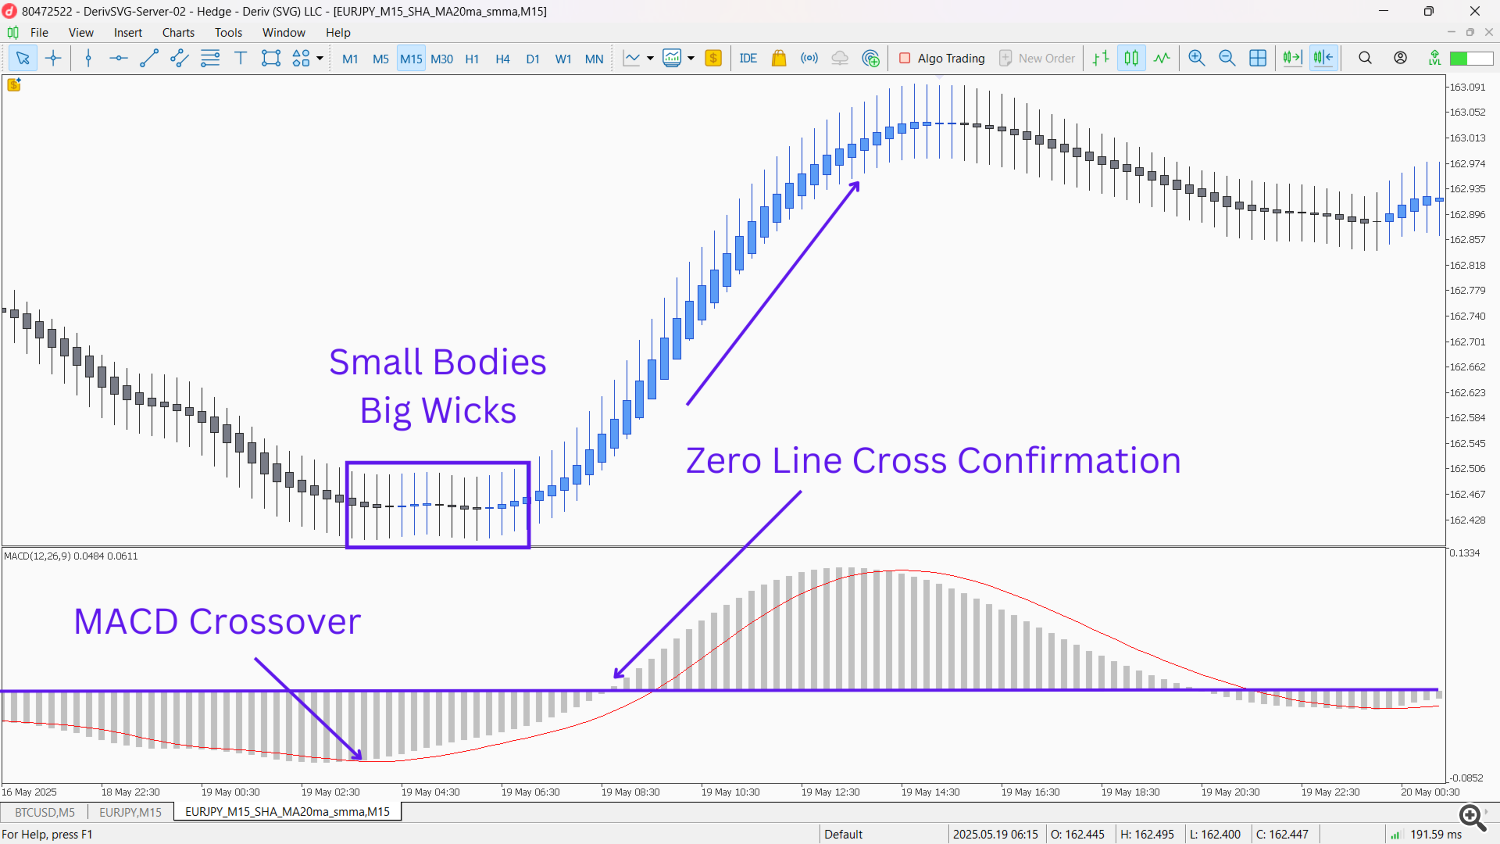
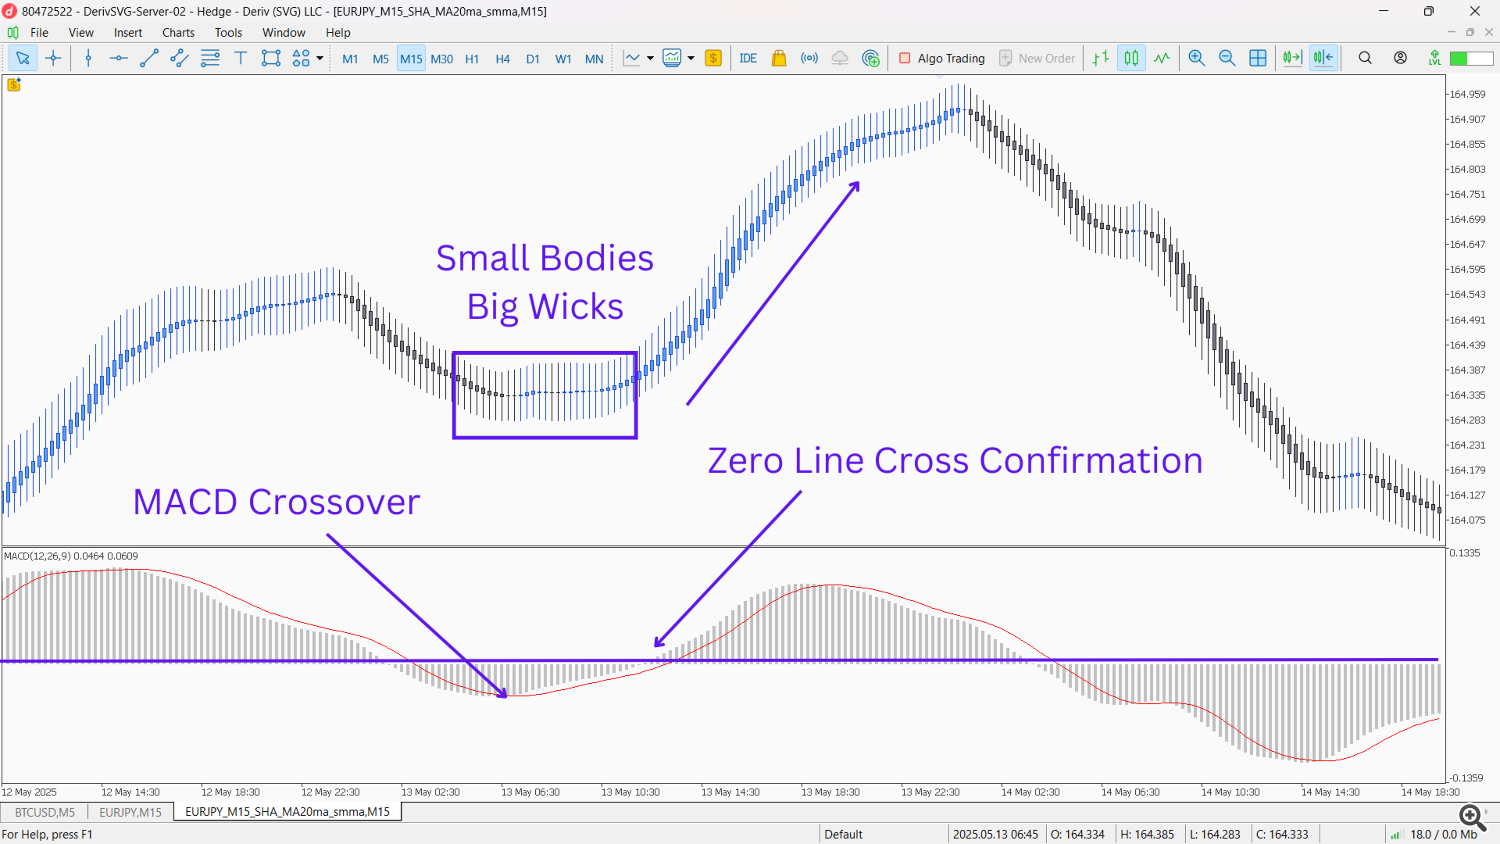
- Heiken Ashi + MACD Crossover and Zero Line Confirmation:
- Setup: Place the MACD indicator (e.g., 12, 26, 9) on your Heiken Ashi chart.
- Signal: During a downtrend, if the Heiken Ashi candles start showing indecision or turn green, and concurrently the MACD line crosses above the signal line, followed by the MACD histogram moving above the zero line, it strongly suggests a bullish reversal. The opposite applies for a bearish reversal (MACD line crosses below signal, histogram below zero line during an uptrend).
- Rationale: MACD provides momentum and trend direction, offering strong confirmation for reversals visually indicated by Heiken Ashi.
Your Trading Journey Begins!
Heiken Ashi is more than just a different way to look at prices; it’s a philosophy of trading that prioritizes clarity over noise. By filtering out the minor fluctuations, it allows traders to focus on the underlying trend, reducing emotional reactions to market volatility.
Armed with the knowledge of how to leverage true Heiken Ashi charts (and smoothed versions) in MetaTrader 5, you’re now empowered to explore its full potential. We encourage you to open your MT5 platform, install a Heiken Ashi EA, and witness firsthand how your favorite indicators transform when applied to these smoothed charts. Experiment with different combinations, backtest various strategies, and discover how Heiken Ashi can bring a new level of precision and confidence to your trading decisions. Good luck, and may your trends be ever clear!
Trial Vs Pro Version
|
Trial |
Pro |
|
Fixed Historical Data |
Unlimited Historical Data |
|
No Market Book Update |
Market Book Update |