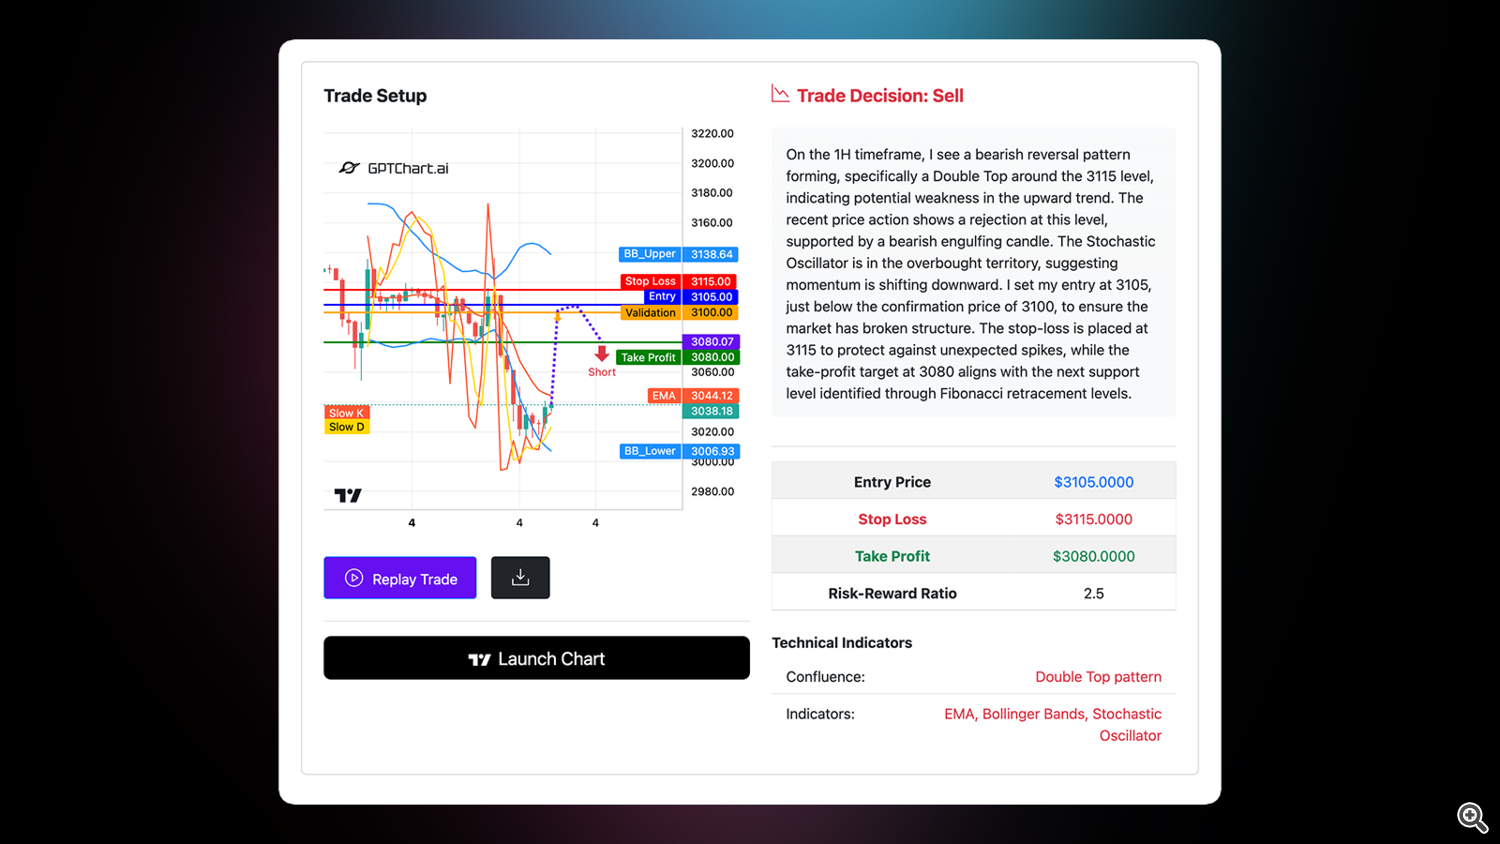
What makes GPTChart different from other trading tools isn’t just the automation—it’s the reasoning behind every trade idea.
Take this example from the platform (see image above). On the 1H timeframe, the AI identified a Double Top pattern forming around a key resistance level. But it didn’t stop there.
Here’s what GPTChart actually does under the hood:
-
Analyzes price action: Recognizes patterns like engulfing candles, rejections, and market structure shifts.
-
Reads indicators in context: Uses Bollinger Bands, EMA, and the Stochastic Oscillator to confirm momentum changes.
-
Defines structured trade levels: Entry, Stop Loss, Take Profit, and Validation zones are calculated based on support/resistance, Fibonacci retracement levels, and recent highs/lows.
-
Applies risk logic: Calculates the risk-reward ratio automatically and ensures setups follow logical trade structures—like a 2.5 R:R ratio in this case.
Each trade idea includes a full explanation, not just chart levels. GPTChart doesn’t pull data from random internet sources. It’s trained using market data from APIs, combined with curated trading logic and strategies—like break and retest, validation zones, and pattern recognition.
The goal is to give traders an edge through structured confluence—not vague signals.
See it in action: https://gptchart.ai
