Welcome to The Market’s Compass Emerging Market’s Country ETF Study, Week #537. As always, it highlights the technical changes of the 20 EM Country ETFs that I track on a weekly basis and publish every third week. Paid subscribers will receive this week’s unabridged Emerging Market’s Country ETF Study sent to their registered e-mail. Free subscribers will receive, on occasion, an excerpt of the full version. Past publications can be accessed by paid subscribers via The Market’s Compass Substack Blog. Next week we will be publishing the The Market’s Compass Developed Markets Country ETF Study. On Sunday I published the latest edition of The Market’s Compass Crypto Sweet Sixteen Study which I publish on a weekly basis and tracks the technical changes of sixteen of the larger capitalized Cryptocurrencies.
To understand the methodology used in constructing the objective EM Country ETF Individual Technical Rankings visit the mc’s technical indicators page at www.themarketscompass.com and select “em country etfs”.
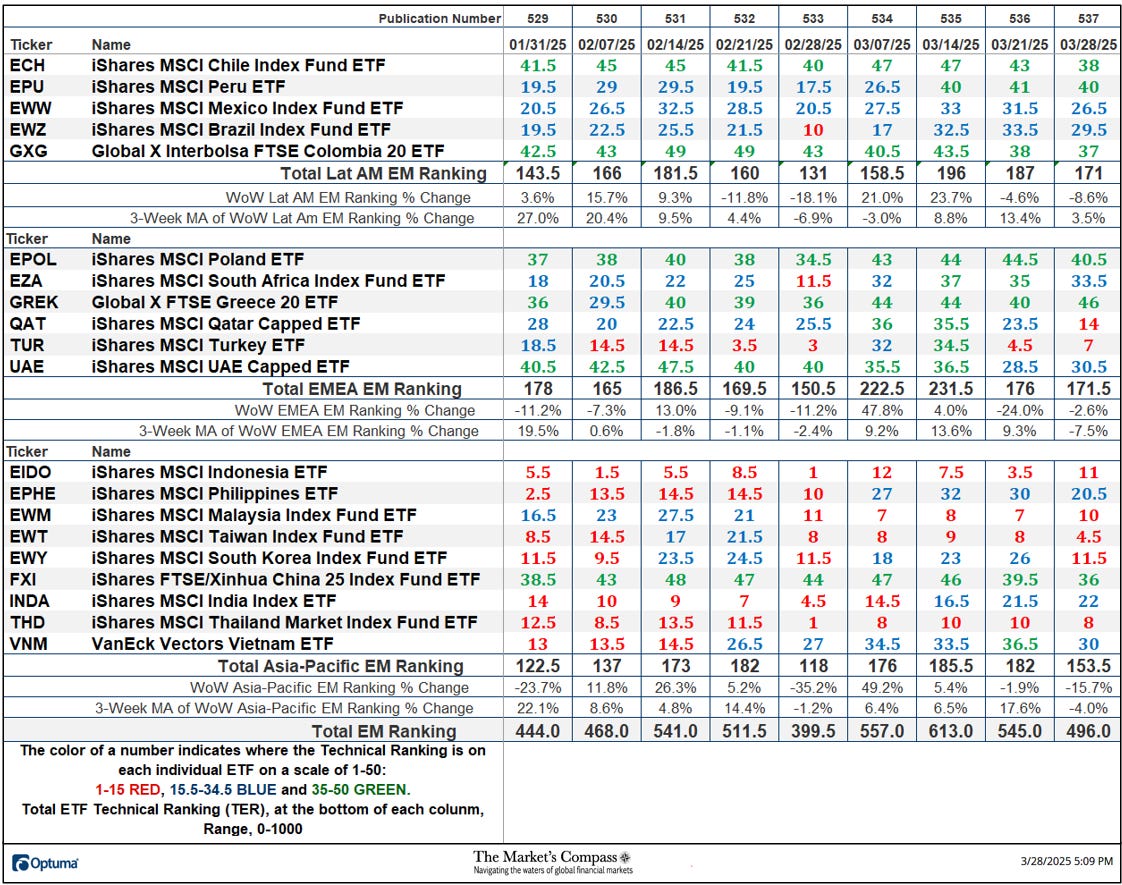
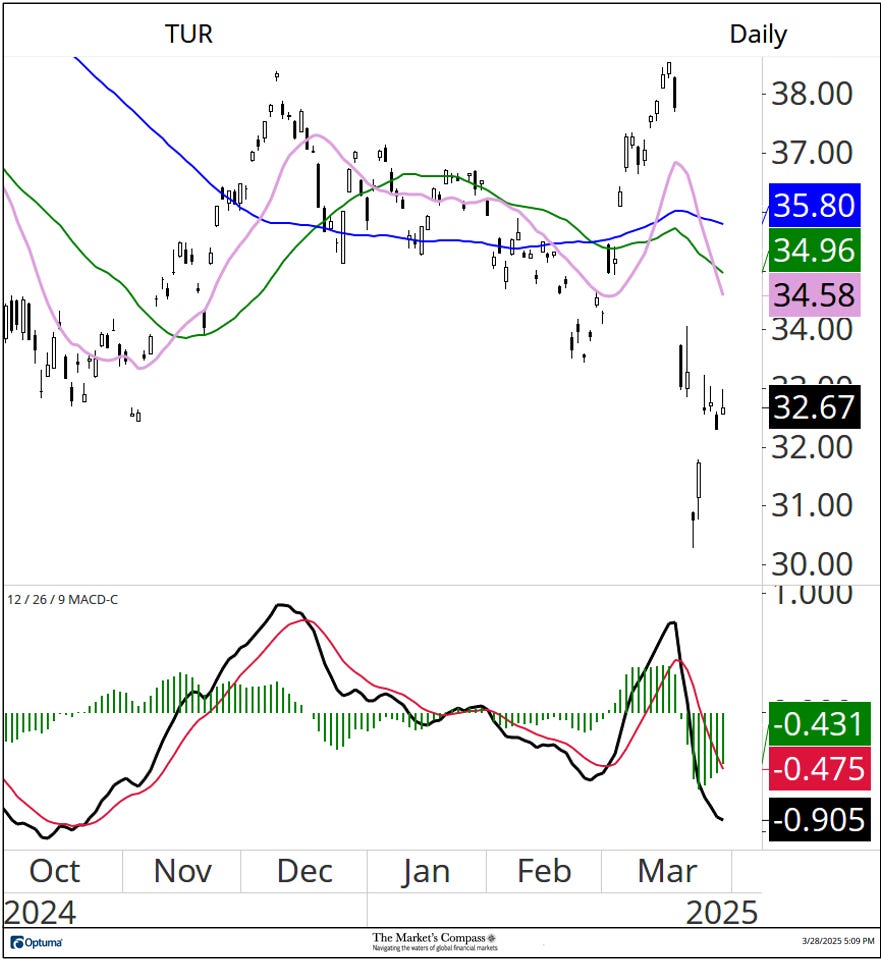
This past week The Total EM Technical Ranking, “TEMTR” fell by -8.99% to 496 from 545 adding to the -11.09% loss the week before from 613 three weeks ago. The Total Asia-Pacific EM Ranking fell the most of the three, down -15.7% to 153.5 from 182 the previous week. The Total Lat AM EM Ranking fell -8.6% to 171 from 187. The EMEA EM Total Technical Ranking fell the least, down -2.6% to 171.5 from 176 the previous week. It should be noted that the iShares MSCI Turkey ETF (TUR) TR has lately been on a nasty price and TR “roller coaster ride”. After rising to 34.5 three weeks ago, it fell by 30 “handles” to 4.5 two weeks ago before last week’s small recovery to 7. Posted below is the daily candle stick chart of the TUR with MACD in the lower panel.
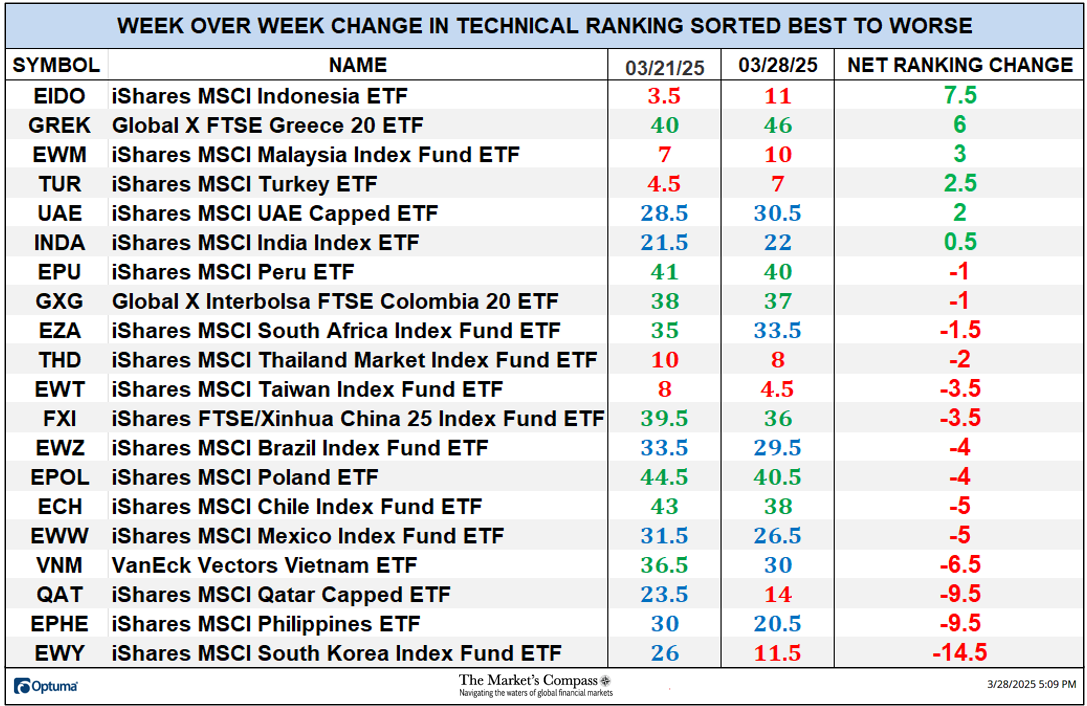
Six of the twenty EM Country ETFs I track in these pages registered improvement in their TRs on a WoW basis, and fourteen ETF TRs fell. The average TR loss was -2.45 vs. the previous week’s average TR loss of -3.40 when thirteen out of twenty fell. Six of the EM Country ETF TRs ended the week in the “green zone” (TRs between 34.5 and 50), seven were in the “blue zone” (TRs between 15.5 and 34) and seven were in the “red zone” (TRs between 0 and 15). That was a slight deterioration from the previous week when eight were in the “green zone”, seven were in the “blue zone” and five were in the “red zone”.
*To understand the construction the of The Technical Condition Factors visit the mc’s technical indicators page at www.themarketscompass.com and select “em country etfs”.
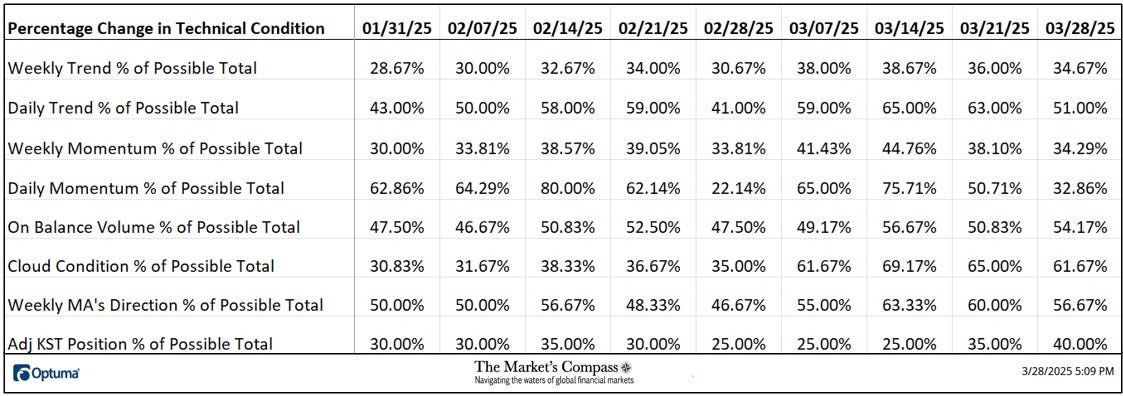
This past week a 32.86% reading was registered in the Daily Momentum Technical Condition Factor (”DMTCF”) or 46 out of a possible total of 140 positive points. That was a drop from the week before reading of 50.71% or 71 which was a continued drop from 75.71% or 106 three weeks ago.
As a confirmation tool, if all eight TCFs improve on a week-over-week basis, more of the 20 ETFs are improving internally on a technical basis, confirming a broader market move higher (think of an advance/decline calculation). Conversely if all eight TCFs fall on a week-over-week basis it confirms a broader market move lower. Last week all two TCFs rose, and six fell.
*A brief explanation of how to interpret RRG charts visit the mc’s technical indicators page at www.themarketscompass.com and select “em country etfs”. To learn more detailed interpretations, see the postscripts and links at the end of this Blog.
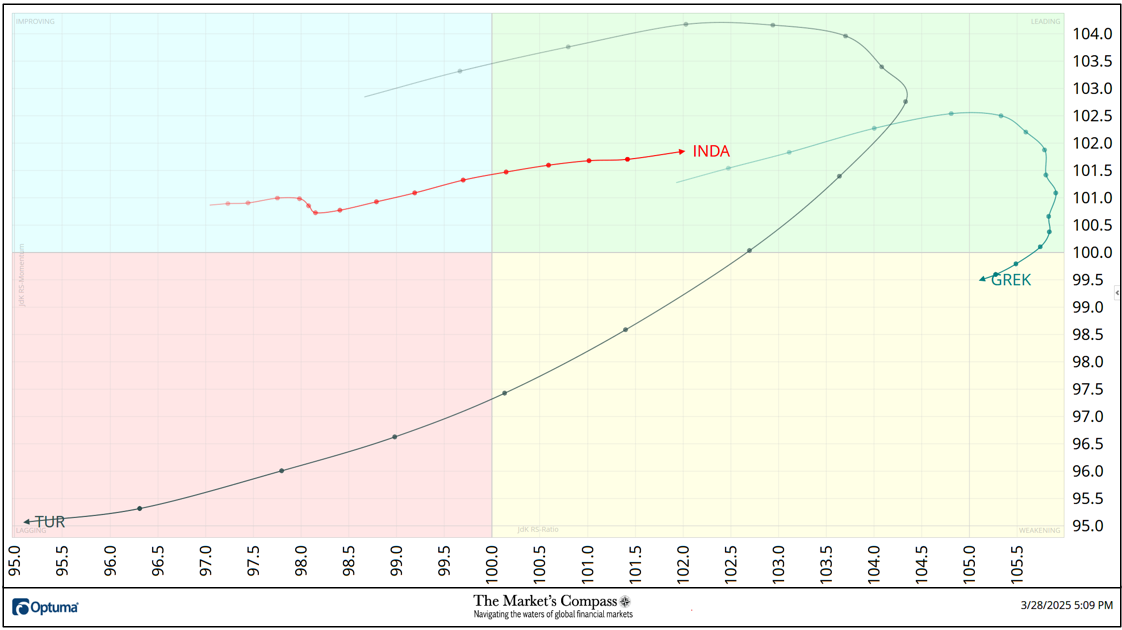
The chart below has three weeks, or 15 days, of Relative data points vs. the benchmark, the CCi30 Index, at the center, deliniated by the dots or nodes. Not all 20 ETFs are plotted in this RRG Chart. I have done this for clarity purposes. Those which I believe are of higher technical interest remain.
After viewing the daily chart of the iShares MSCI Turkey ETF (TUR) earlier in this week’s blog the sharp reversal in Relative Strength and Relative Strength Momentum is hardly a surprise. A week ago, last Monday the TUR began to roll over in the Leading Quadrant and began to rapidly lose Relative Strength Momentum as it accelerated lower in the Weakening Quadrant (note the distance between the nodes or dots that mark the day-to-day change). Last Tuesday it gathered a pace and entered the Lagging Quadrant. Diametrically opposed over the past two weeks has been the iShares MSCI India Index ETF (INDA) which has exhibited a controlled advance out of the Improving Quadrant into the Leading Quadrant. The Global X FTSE Greece 20 ETF (REK) had been rising at a good “clip” in the Leading Quadrant three weeks ago until it stalled and rolled over and entered the Weakening Quadrant at the end of last week.
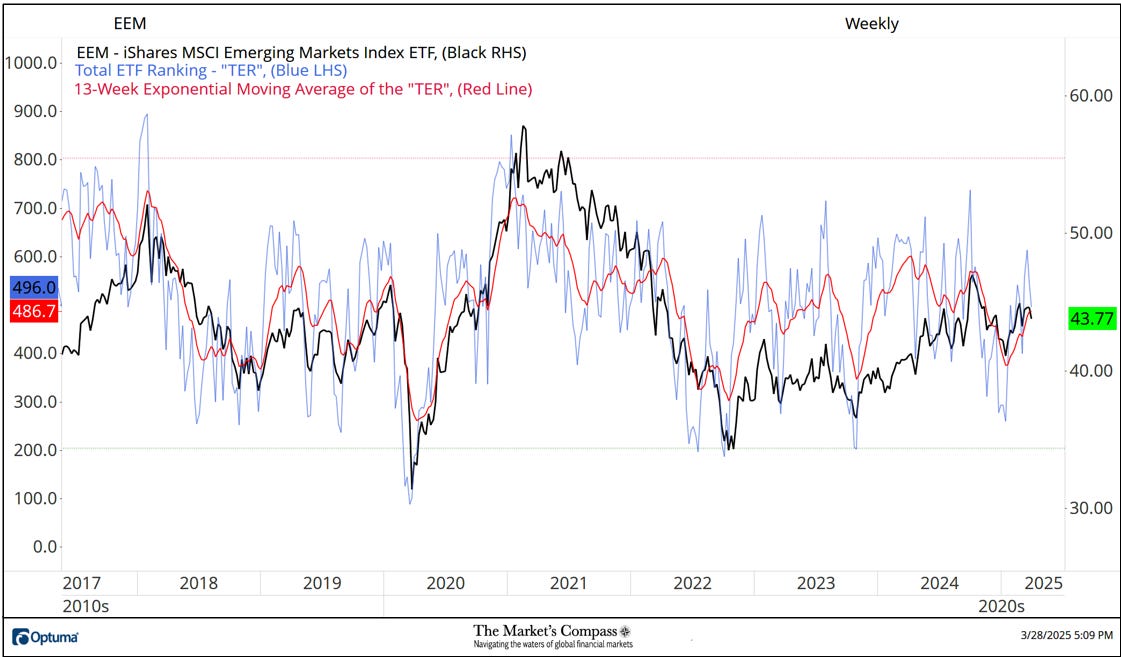
An explanation of the The Total EM Technical Ranking Indicator and its interpretation visit the mc’s technical indicators page at www.themarketscompass.com and select “em country etfs”.
The EEM has been trading sideways since the middle of February. The TER did mark mark a higher high three weeks ago but has since rolled over,, but the 13-week exponential moving average continues to track higher (aside from a brief blip lower) since the January 10th turn when the TER bottomed. More on the long-term technical condition of the EEM in the Candlestick chart that follows.
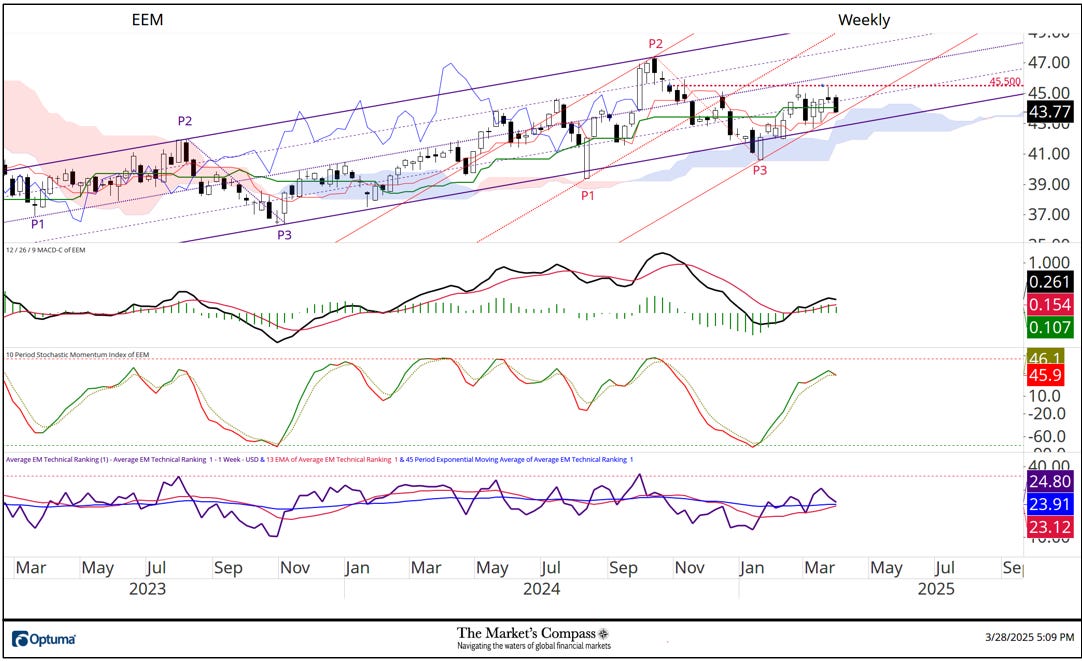
The Average Weekly Technical Ranking (“ATR”) is the average Technical Ranking (“TR”) of the 20 Emerging Markets Country ETFs we track weekly and is plotted in the lower panel on the Weekly Candle Chart of the EEM presented below. Like the TER, it is a confirmation/divergence or overbought/oversold indicator.
The Weekly Candlestick Chart above better reflects the sideways price action over the past seven weeks, then the preceding much longer-term line chart. After a follow-through advance at the price pivot low for the week ending January 17th that held at Cloud support, the EEM rallied back into the confines of the longer-term Standard Pitchfork (violet P1 through P3). I then added a shorter-term Standard Pitchfork (red P1 through P3). Despite the sideways price action prices have dutifully held support at the Upper Span of the of the Cloud and the Lower Parallel (solid red lower line) of the Pitchfork. MACD reflects the slowing of upside price momentum and the shorter-term Stochastic Momentum Index has turned lower and has just edged below its signal line. Only a rally that drives prices through the 45.50 level and the Median Line (violet dotted line) of the longer-term Standard Pitchfork would suggest that there is something more than a counter trend rally is developing.
Learn about Pitchforks and Internal Lines in the three-part Pitchfork tutorial in the Market’s Compass website, www.themarketscompass.com
More on the technical condition of the EEM in Thoughts on the Short-Term Technical Condition of the EEM but first…
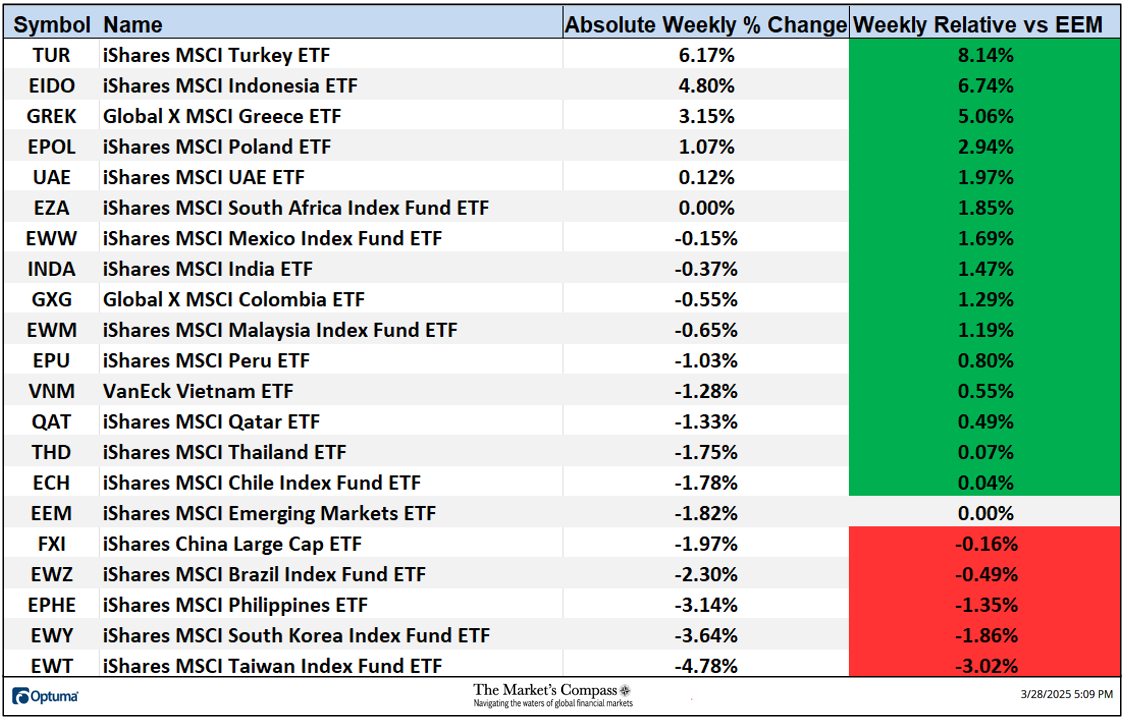
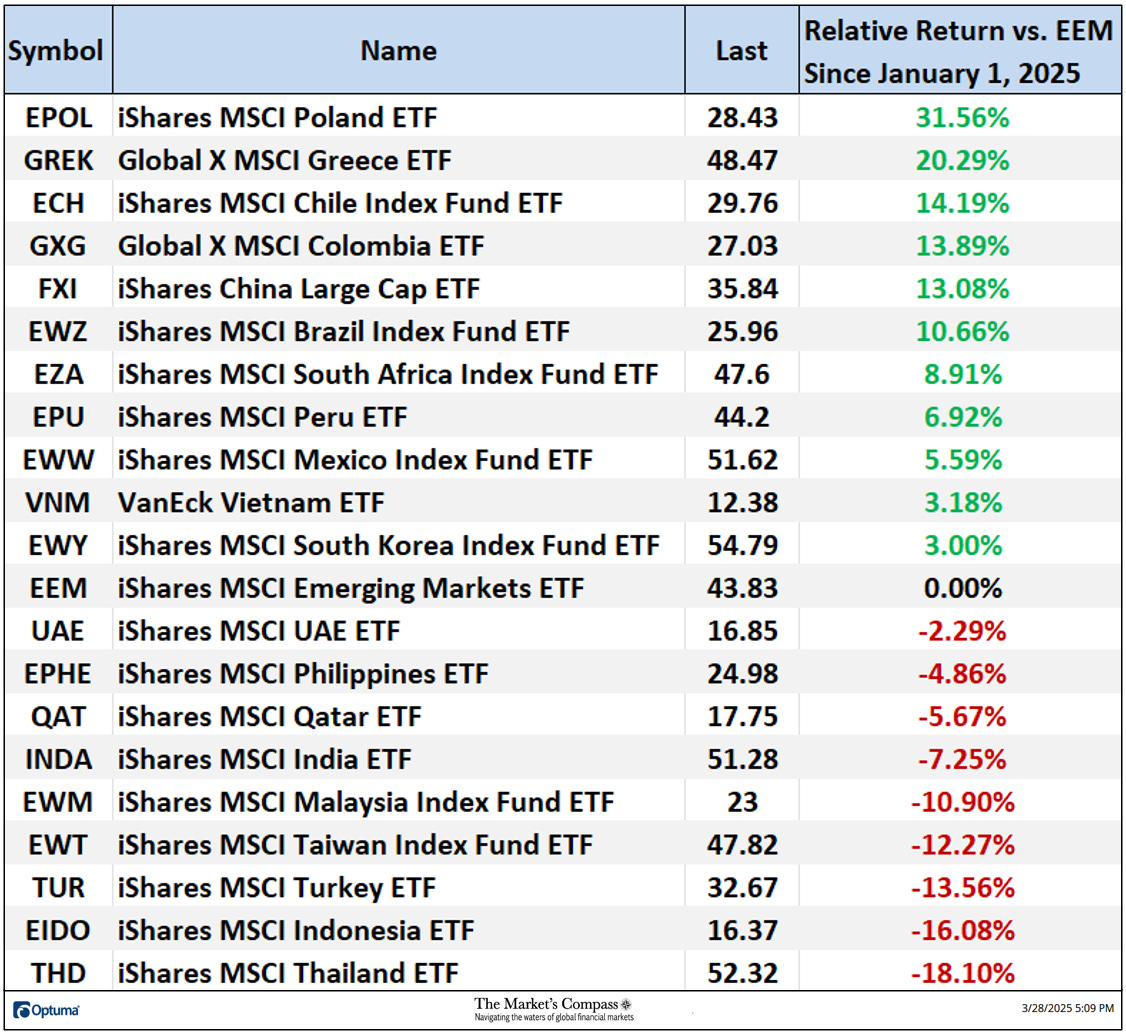
*For the week ending March 28th. Does not include dividends if any.
Five of the twenty EM Country ETFs were up on an absolute basis last week (the EZA was flat on the week) and fourteen traded lower. Fifteen EM ETFs outperformed the -1.82% loss in the EEM on a relative basis. The average five-day absolute loss in EM ETFs was -0.53% (including the EEM), reversing the previous week’s average absolute gain of +1.21%.
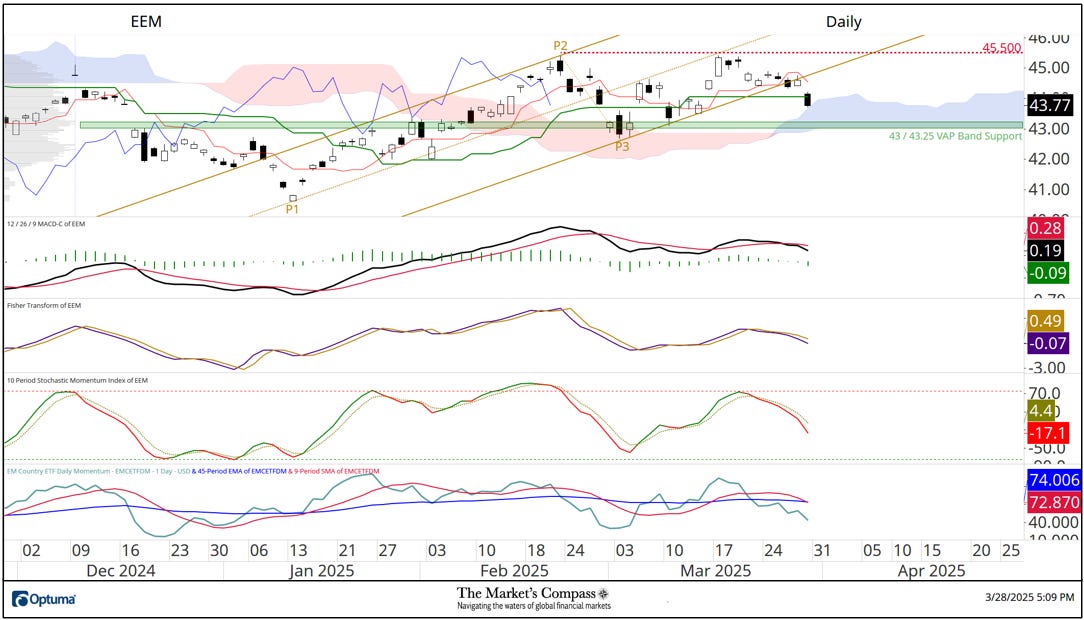
After falling below potential support at the Kijun Plot on Friday, the EEM ended the week teetering on Daily Cloud support. Both momentum oscillators and the Fisher Transform are tracking lower below their signal lines. The EM Country ETF Daily Momentum / Breadth Oscillator continues to course lower below both moving averages. A break of Cloud support will likely target support at the VAP (Volume at Price) band at 43/43.25.
All the charts are courtesy of Optuma whose charting software enables anyone to visualize any data including my Objective Technical Rankings. The following links are an introduction and an in-depth tutorial on RRG Charts…
https://www.optuma.com/videos/introduction-to-rrg/
https://www.optuma.com/videos/optuma-webinar-2-rrgs/
To receive a 30-day trial of Optuma charting software go to…
