XAUUSD Daily Chart Analysis – May 7, 2025
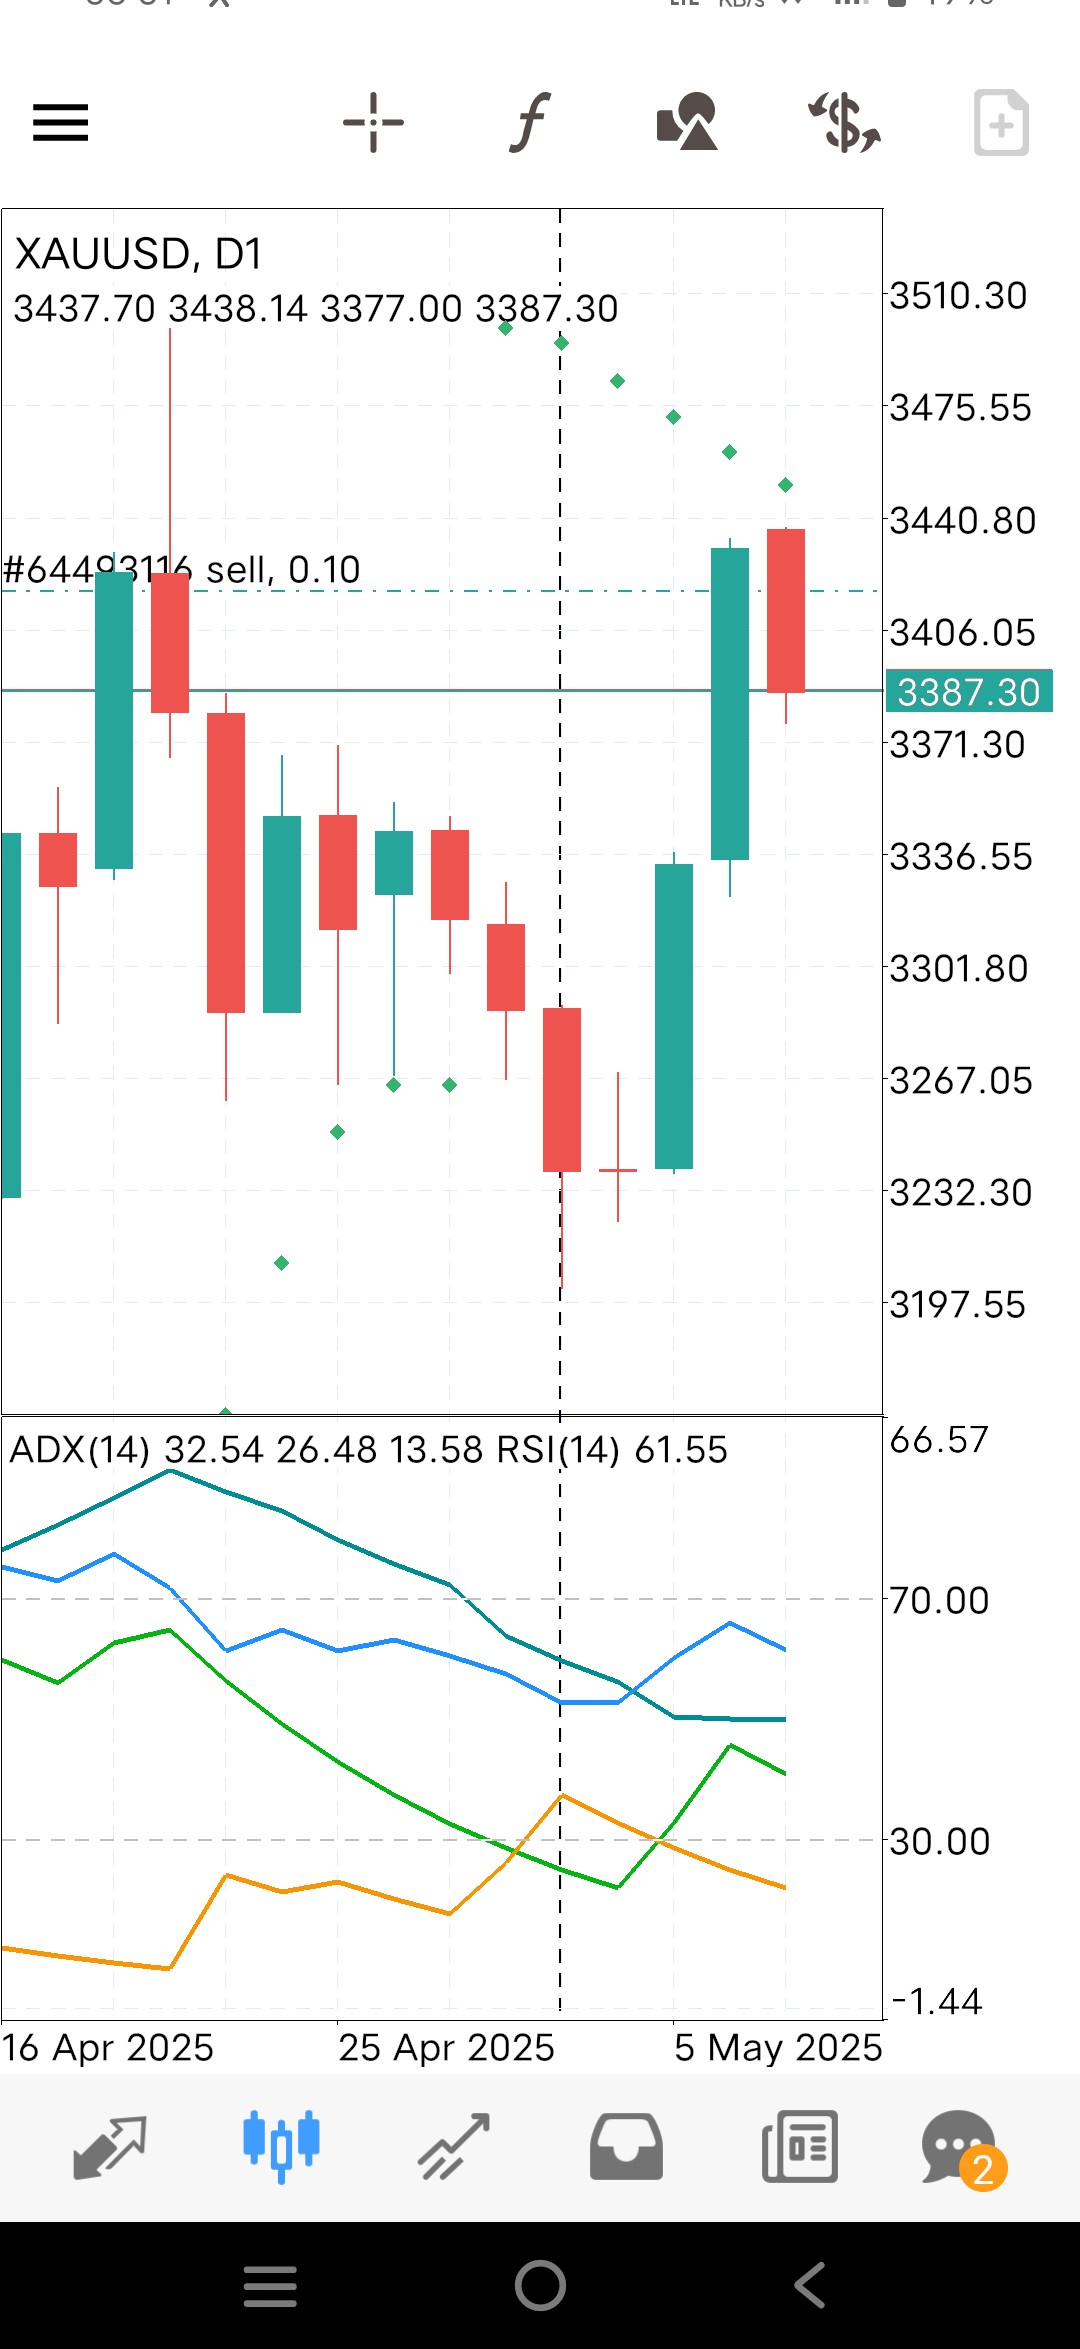
The recent price action in the XAUUSD (Gold/USD) daily chart reveals a significant shift in market momentum, as evident from the bullish recovery followed by a slight correction.
Key Highlights:
Current Price: 3387.30
Previous High/Low: 3438.14 / 3377.00
Indicators
:
ADX(14):32.54 – Indicates a strong trend.
RSI(14): 61.55 – Momentum is currently bullish but approaching overbought territory.

A strong bullish candle on May 6 pushed price upwards from the 3230–3260 demand zone, breaking past the psychological level of 3300 and reaching above 3400.
The recent red candle shows some profit booking or minor correction after a strong rally.
The dotted green markers suggest possible parabolic SAR points, indicating that the bullish trend might still be intact unless there is a close below 3370.
Trend Strength (ADX Analysis):
ADX value above 30 confirms a strong directional trend.
The DI+ (blue) is rising while DI− (orange) is declining, confirming bullish control over the market.
Momentum (RSI Analysis):
RSI at 61.55 suggests buying strength but is getting closer to the overbought zone (70).
If RSI continues to rise with price support, we might see another upward leg.
Conclusion:
Gold has shown a strong reversal with a potential continuation of the uptrend. Traders should watch for a daily close above 3400 to confirm bullish continuation. A drop below 3370 could lead to further correction toward the 3300 level.
Suggested Strategy:
Buy above 3406 with target: 3440 / 3480
Sell below 3370 with target: 3330 / 3300
Use proper risk management and confirm with candlestick patterns or volume for entries.